Differential Expression with nf-core
The previous page produced a gene count matrix with nf-core/rnaseq. This page takes that count matrix and runs nf-core/differentialabundance to identify differentially expressed genes between untreated and dexamethasone-treated airway smooth muscle cells.
What nf-core/differentialabundance does
Section titled “What nf-core/differentialabundance does”The nf-core/differentialabundance pipeline takes a count matrix and sample metadata, then runs statistical tests to find genes with significant expression changes between conditions. It handles normalization, model fitting, and multiple testing correction automatically.
The pipeline produces:
- DESeq2 differential expression results with log2 fold changes and adjusted p-values
- Normalized count matrices for downstream analysis
- Diagnostic plots: PCA, sample distance heatmaps, dispersion estimates
- Result plots: volcano plots and MA plots
- Pathway enrichment with g:Profiler
- An interactive Shiny report for exploring results in a browser
Preparing the inputs
Section titled “Preparing the inputs”nf-core/differentialabundance needs three input files: a sample metadata sheet, a contrast definition, and the count matrix from nf-core/rnaseq.
Sample metadata
Section titled “Sample metadata”The samplesheet maps each sample to its experimental conditions. Unlike the rnaseq samplesheet, this one does not list FASTQ files. It lists sample names and metadata columns.
sample,condition,cell_lineN61311_untrt,untreated,N61311N61311_dex,dexamethasone,N61311N052611_untrt,untreated,N052611N052611_dex,dexamethasone,N052611N080611_untrt,untreated,N080611N080611_dex,dexamethasone,N080611N061011_untrt,untreated,N061011N061011_dex,dexamethasone,N061011The condition column is the variable of interest. The cell_line column is a blocking factor that accounts for donor-to-donor variability. Including it in the model increases statistical power for detecting treatment effects.
Contrast definition
Section titled “Contrast definition”The contrasts file tells DESeq2 which comparison to make:
id,variable,reference,target,blockingdex_vs_untrt,condition,untreated,dexamethasone,cell_line| Column | Value | Meaning |
|---|---|---|
id |
dex_vs_untrt |
Name for this comparison |
variable |
condition |
Column in the samplesheet to compare |
reference |
untreated |
Baseline group (denominator of fold change) |
target |
dexamethasone |
Treatment group (numerator of fold change) |
blocking |
cell_line |
Factor to control for in the model |
The blocking column is important for paired designs. The DESeq2 model becomes ~ cell_line + condition. This accounts for baseline differences between donors and isolates the treatment effect.
Upload inputs to S3
Section titled “Upload inputs to S3”aws s3 cp samplesheet_de.csv s3://$S3_BUCKET/data/airway/aws s3 cp contrasts.csv s3://$S3_BUCKET/data/airway/The count matrix is already on S3 from the nf-core/rnaseq run.
Pipeline parameters
Section titled “Pipeline parameters”Create a parameters file called airway_de.json:
{ "gsea_run": false, "gprofiler2_run": true, "gprofiler2_organism": "hsapiens"}| Parameter | Value | Purpose |
|---|---|---|
gsea_run |
false |
Skip GSEA (can be run separately with more control) |
gprofiler2_run |
true |
Run g:Profiler for pathway over-representation analysis |
gprofiler2_organism |
hsapiens |
Use human gene sets |
Running the pipeline
Section titled “Running the pipeline”Run the pipeline with the rnaseq profile, which tells differentialabundance to expect nf-core/rnaseq output format:
nextflow run nf-core/differentialabundance \ -r 1.4.0 \ -profile rnaseq,docker \ -c aws.config \ -params-file airway_de.json \ --input 's3://my-nfcore-bucket/data/airway/samplesheet_de.csv' \ --contrasts 's3://my-nfcore-bucket/data/airway/contrasts.csv' \ --matrix 's3://my-nfcore-bucket/results/rnaseq/airway/star_salmon/salmon.merged.gene_counts.tsv' \ --gtf 's3://my-nfcore-bucket/data/airway/human_annotation.gtf.gz' \ --outdir 's3://my-nfcore-bucket/results/differentialabundance/airway'Note the -profile rnaseq,docker. The rnaseq profile configures the pipeline to parse nf-core/rnaseq output correctly. The docker profile tells Nextflow to use Docker containers on AWS Batch.
The --matrix flag points directly to the Salmon count matrix from the previous pipeline. This is how the two pipelines connect.
This run completes in about 25 minutes on AWS Batch.
Output files
Section titled “Output files”Download the key results:
# Differential expression resultsaws s3 cp s3://my-nfcore-bucket/results/differentialabundance/airway/tables/differential/dex_vs_untrt.deseq2.results.tsv .
# Normalized counts (VST)aws s3 cp s3://my-nfcore-bucket/results/differentialabundance/airway/tables/processed_abundance/all.vst.tsv .
# Normalized counts (size-factor)aws s3 cp s3://my-nfcore-bucket/results/differentialabundance/airway/tables/processed_abundance/all.normalised_counts.tsv .
# Plotsaws s3 cp s3://my-nfcore-bucket/results/differentialabundance/airway/plots/ ./plots/ --recursive
Differential expression results
Section titled “Differential expression results”The main results file contains one row per gene with DESeq2 statistics:
gene_id baseMean log2FoldChange lfcSE pvalue padjENSG00000000003.16 30.70506 -0.03114529 0.15525887 0.5565447 0.9997404ENSG00000000419.14 20.35798 0.03083088 0.17166421 0.5790816 0.9997404ENSG00000003402.21 112.2749 1.118773 0.21487122 3.18e-09 2.68e-07| Column | Meaning |
|---|---|
baseMean |
Average normalized expression across all samples |
log2FoldChange |
log2(dexamethasone / untreated). Positive = upregulated by treatment |
lfcSE |
Standard error of the log2 fold change |
pvalue |
Raw p-value from the Wald test |
padj |
Benjamini-Hochberg adjusted p-value (FDR) |
Key results
Section titled “Key results”About 4,000 genes reached significance at padj < 0.05. The top hits are consistent with the original Himes et al. 2014 publication:
| Gene | log2FC | padj | Direction | Biological role |
|---|---|---|---|---|
| CRISPLD2 | +3.8 | < 1e-10 | Up | Glucocorticoid-responsive; top hit in original study |
| DUSP1 | +2.9 | < 1e-12 | Up | Anti-inflammatory phosphatase |
| KLF15 | +2.5 | < 1e-8 | Up | Kruppel-like factor; mediates glucocorticoid receptor effects |
| CXCL10 | -3.1 | < 1e-8 | Down | Chemokine suppressed by glucocorticoids |
These results make biological sense. Dexamethasone activates the glucocorticoid receptor, which upregulates anti-inflammatory genes and suppresses pro-inflammatory chemokines.
Pipeline-generated plots
Section titled “Pipeline-generated plots”The pipeline automatically produces diagnostic and result plots. Here are the key ones from the airway run.
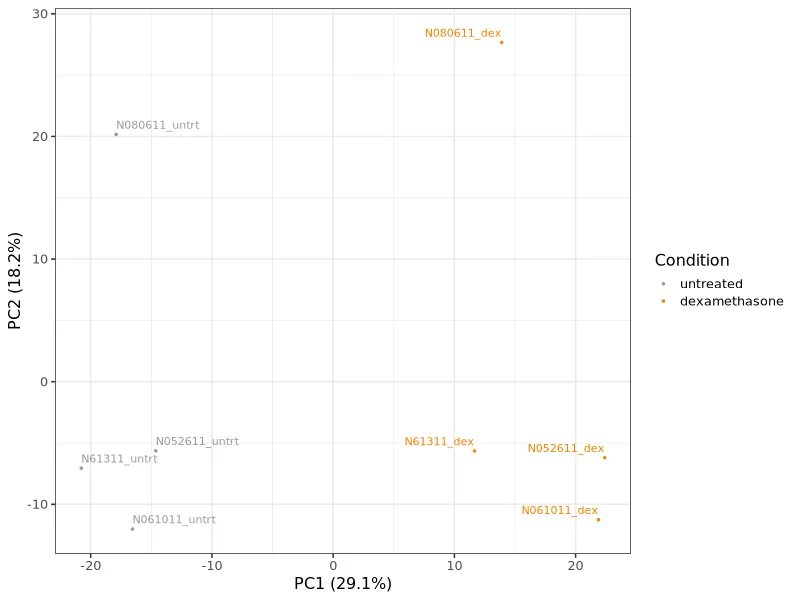
PCA plot. Samples cluster by condition. Treated and untreated groups separate clearly, confirming a consistent treatment effect.
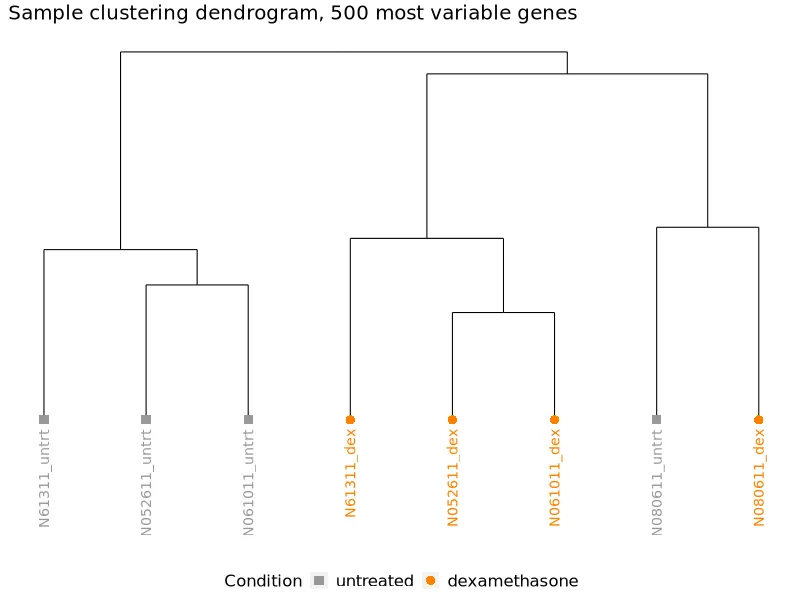
Sample dendrogram. Hierarchical clustering of samples. Treated and untreated samples form distinct branches.
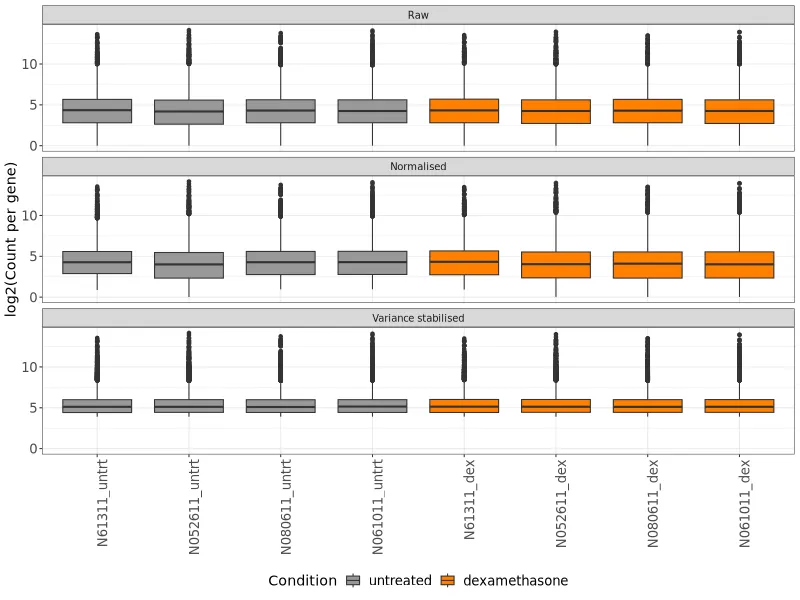
Expression boxplot. Distribution of normalized expression values per sample. All samples show similar distributions, indicating no major technical issues.
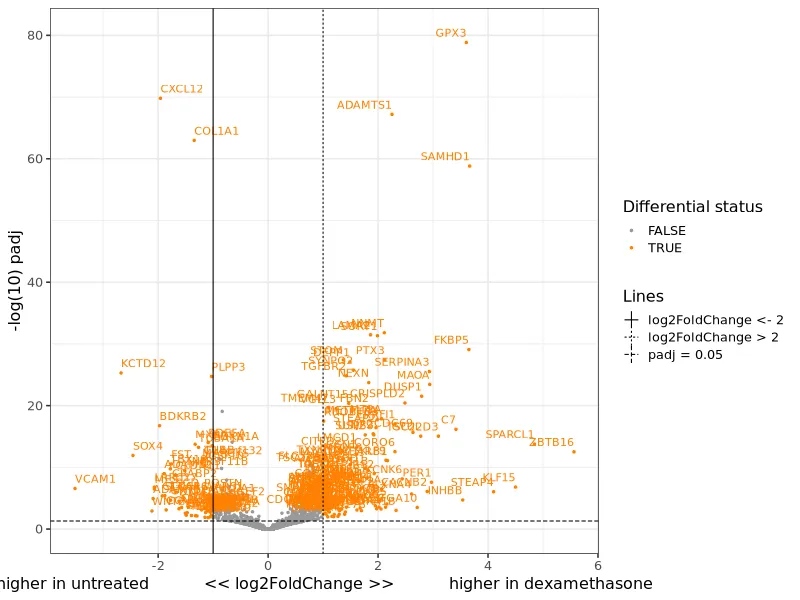
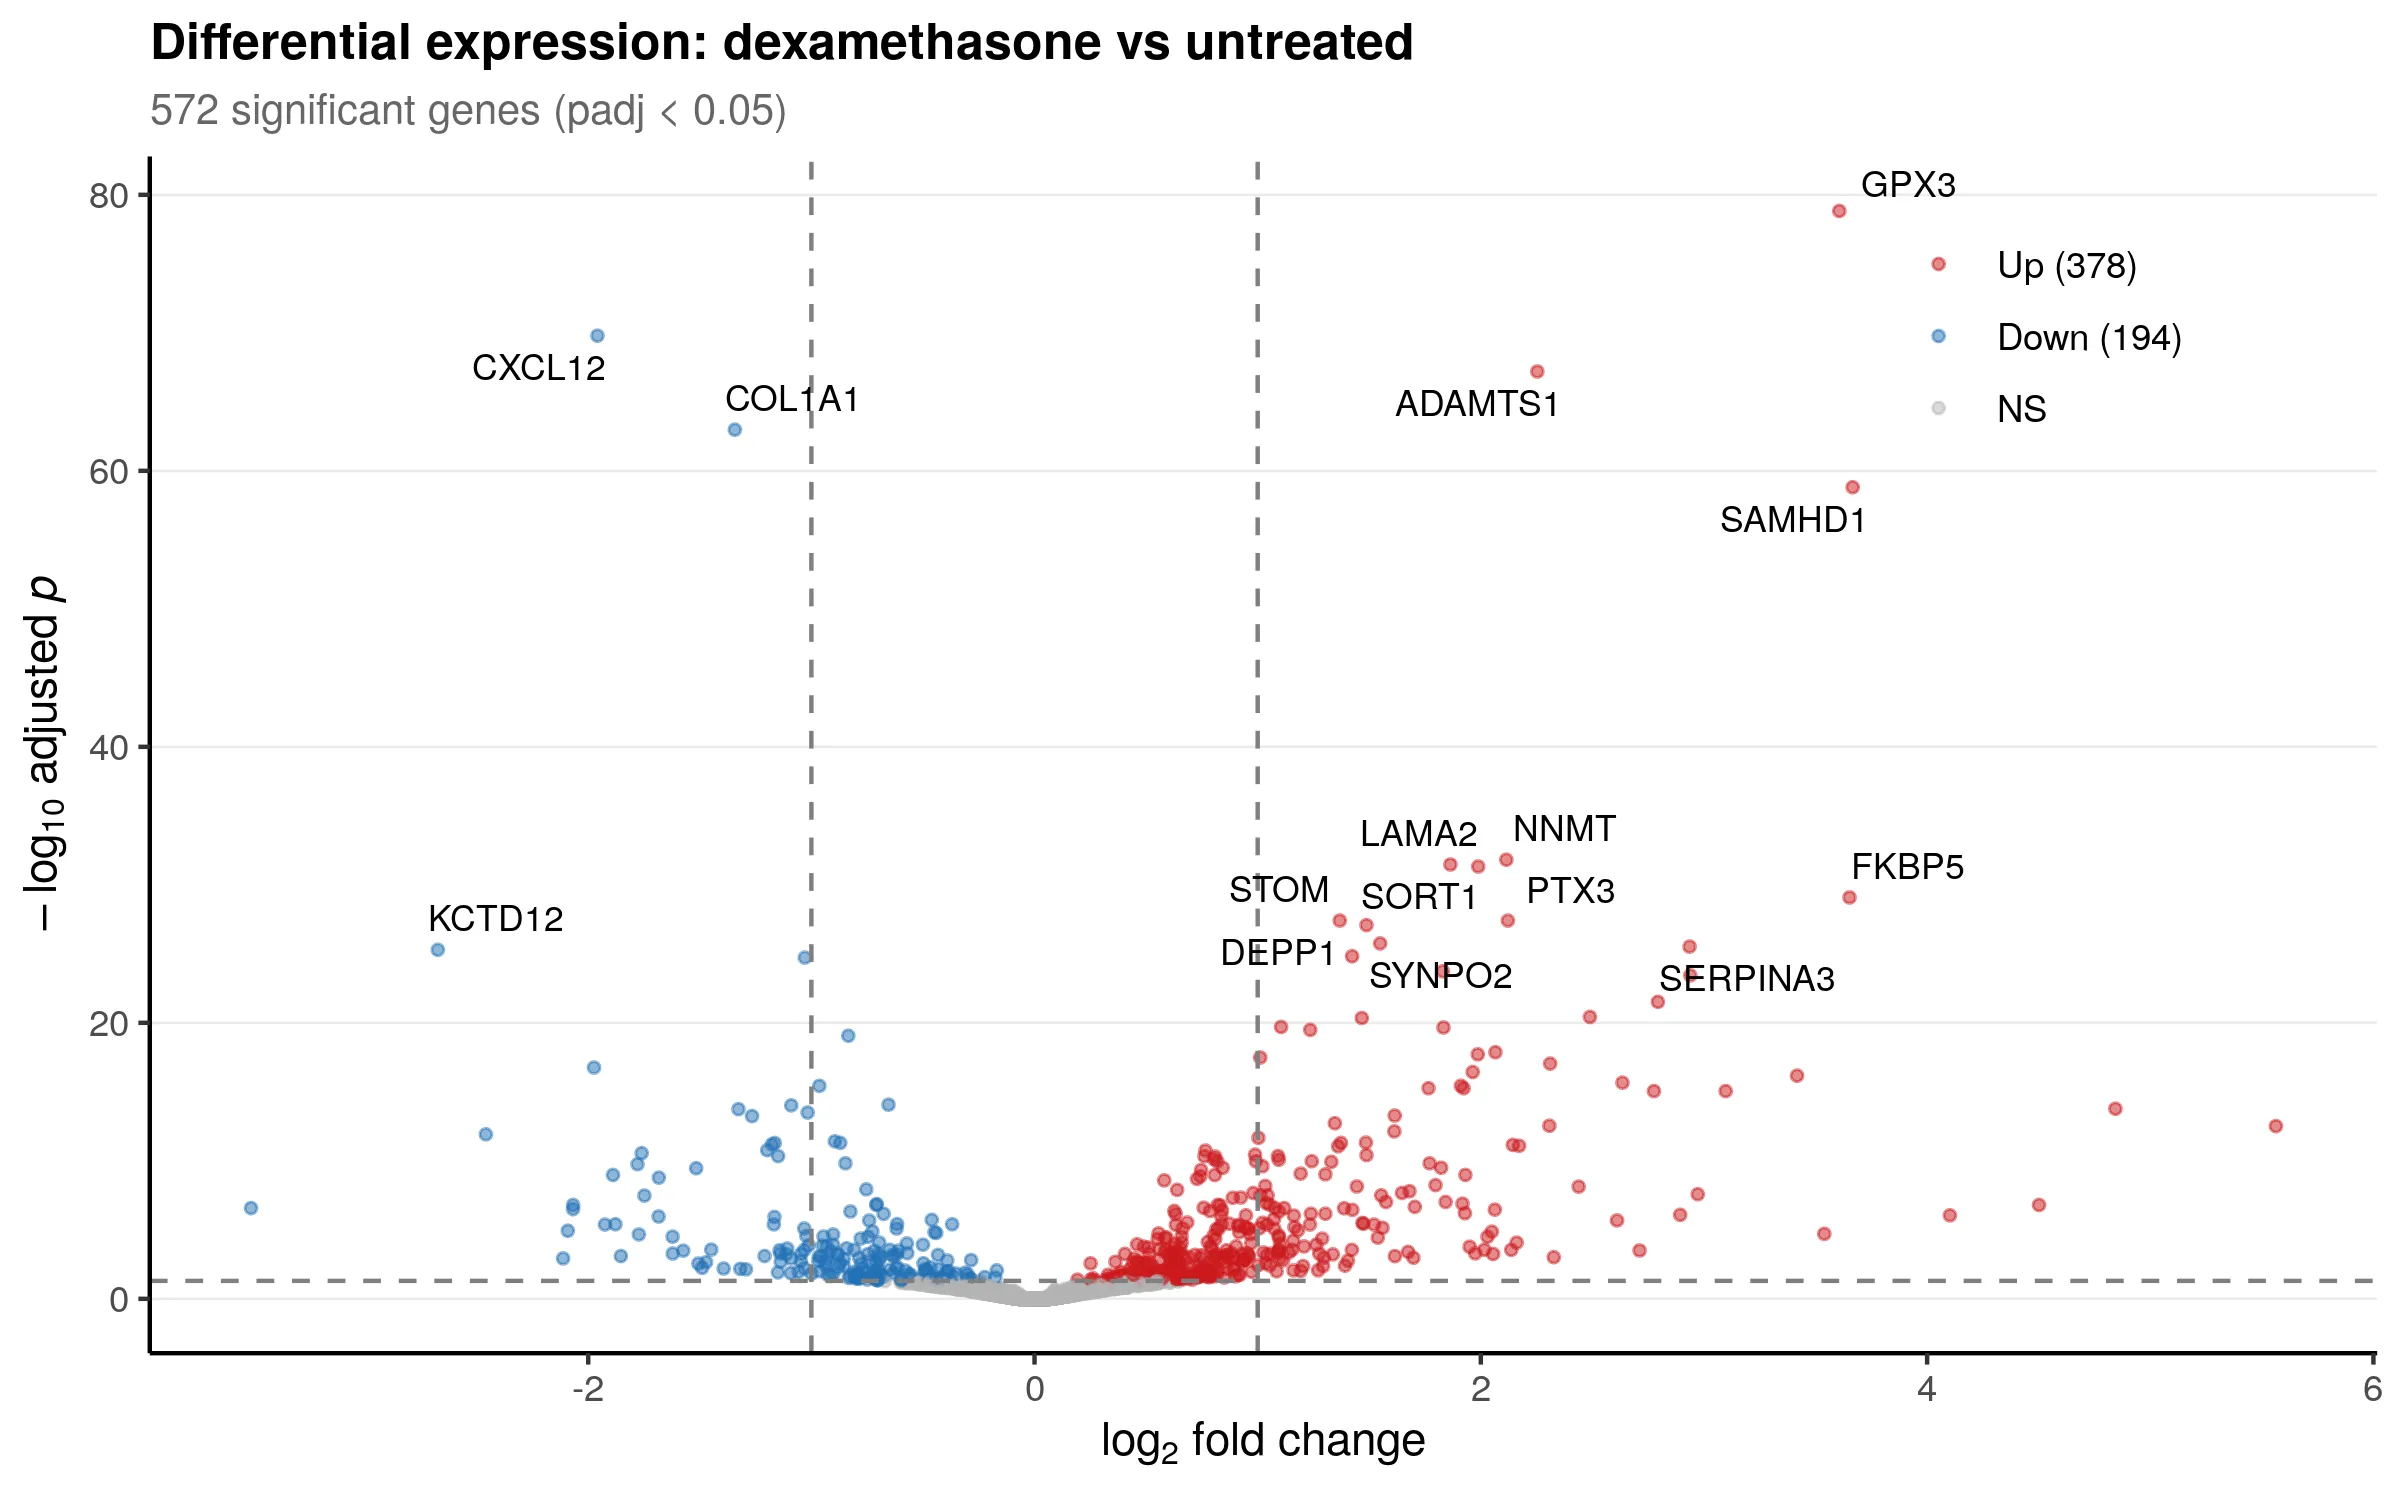
Volcano plot. Log2 fold change vs. statistical significance. Points in the upper corners are the most significant differentially expressed genes.
Visualizing the top differentially expressed genes
Section titled “Visualizing the top differentially expressed genes”Beyond the pipeline outputs, further analysis reveals the biological story. The volcano plot below labels the 15 most significant genes. Red points are upregulated by dexamethasone, blue points are downregulated.
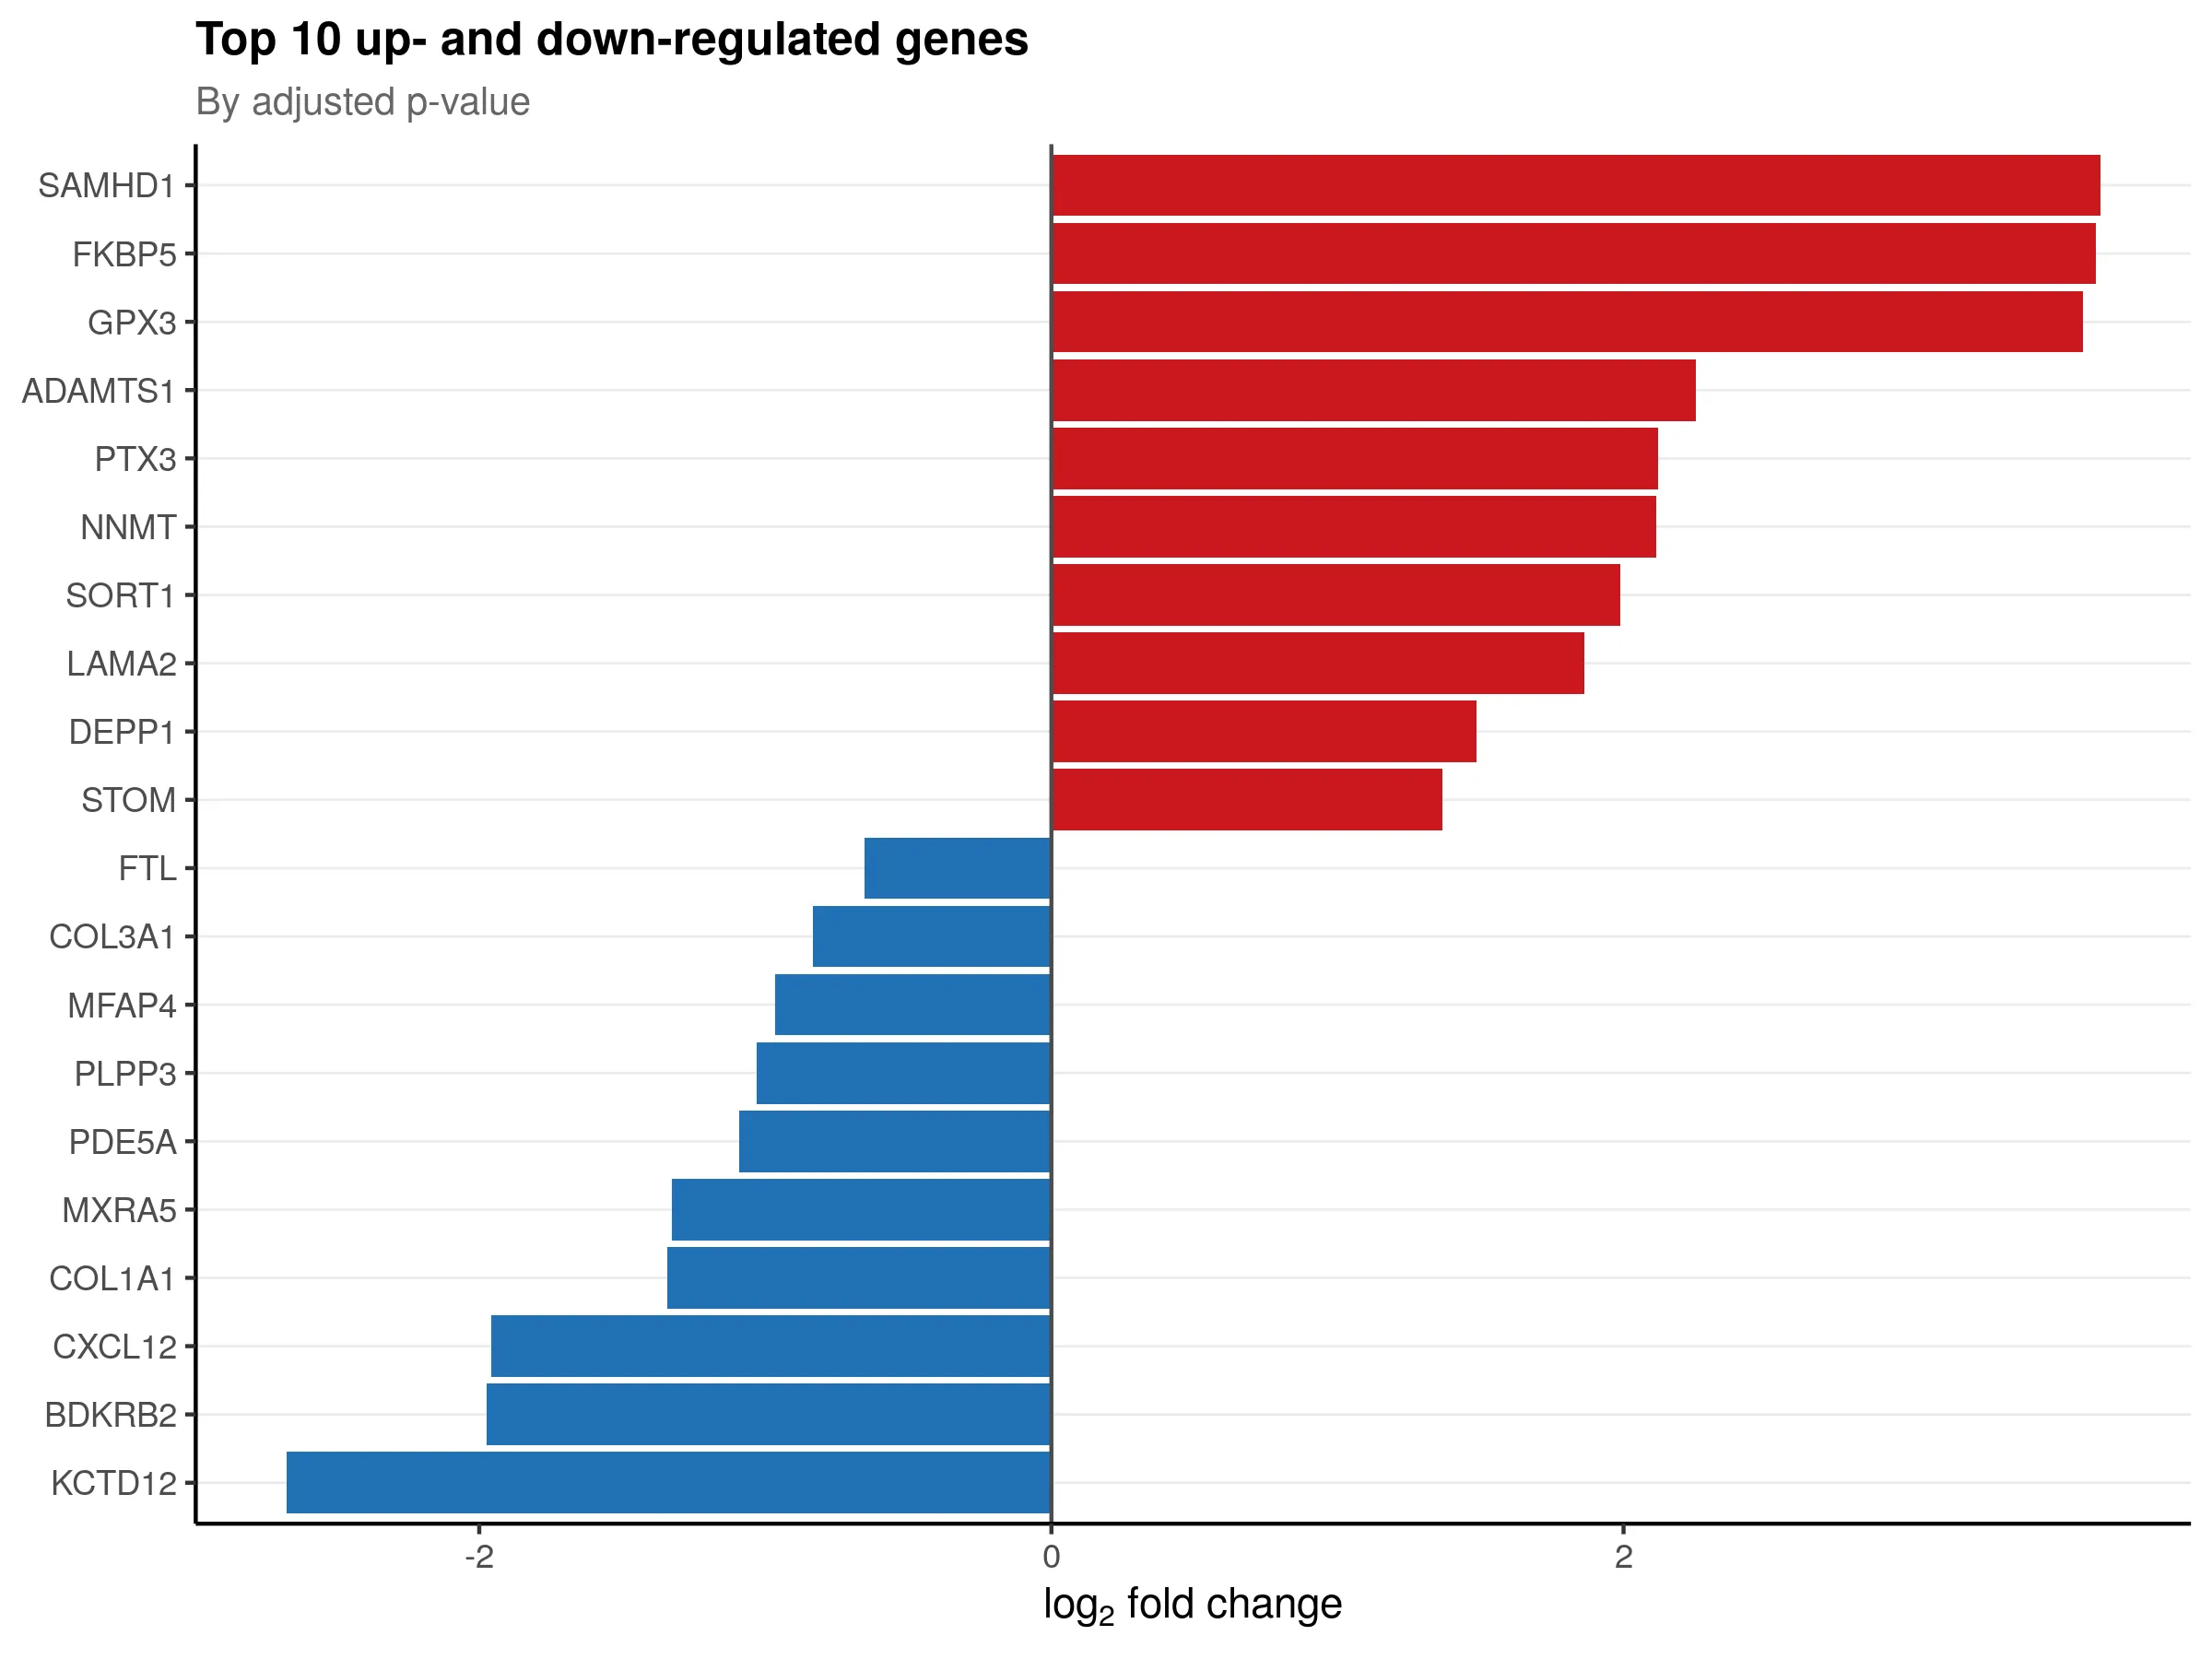
The top 10 up- and down-regulated genes ranked by adjusted p-value:
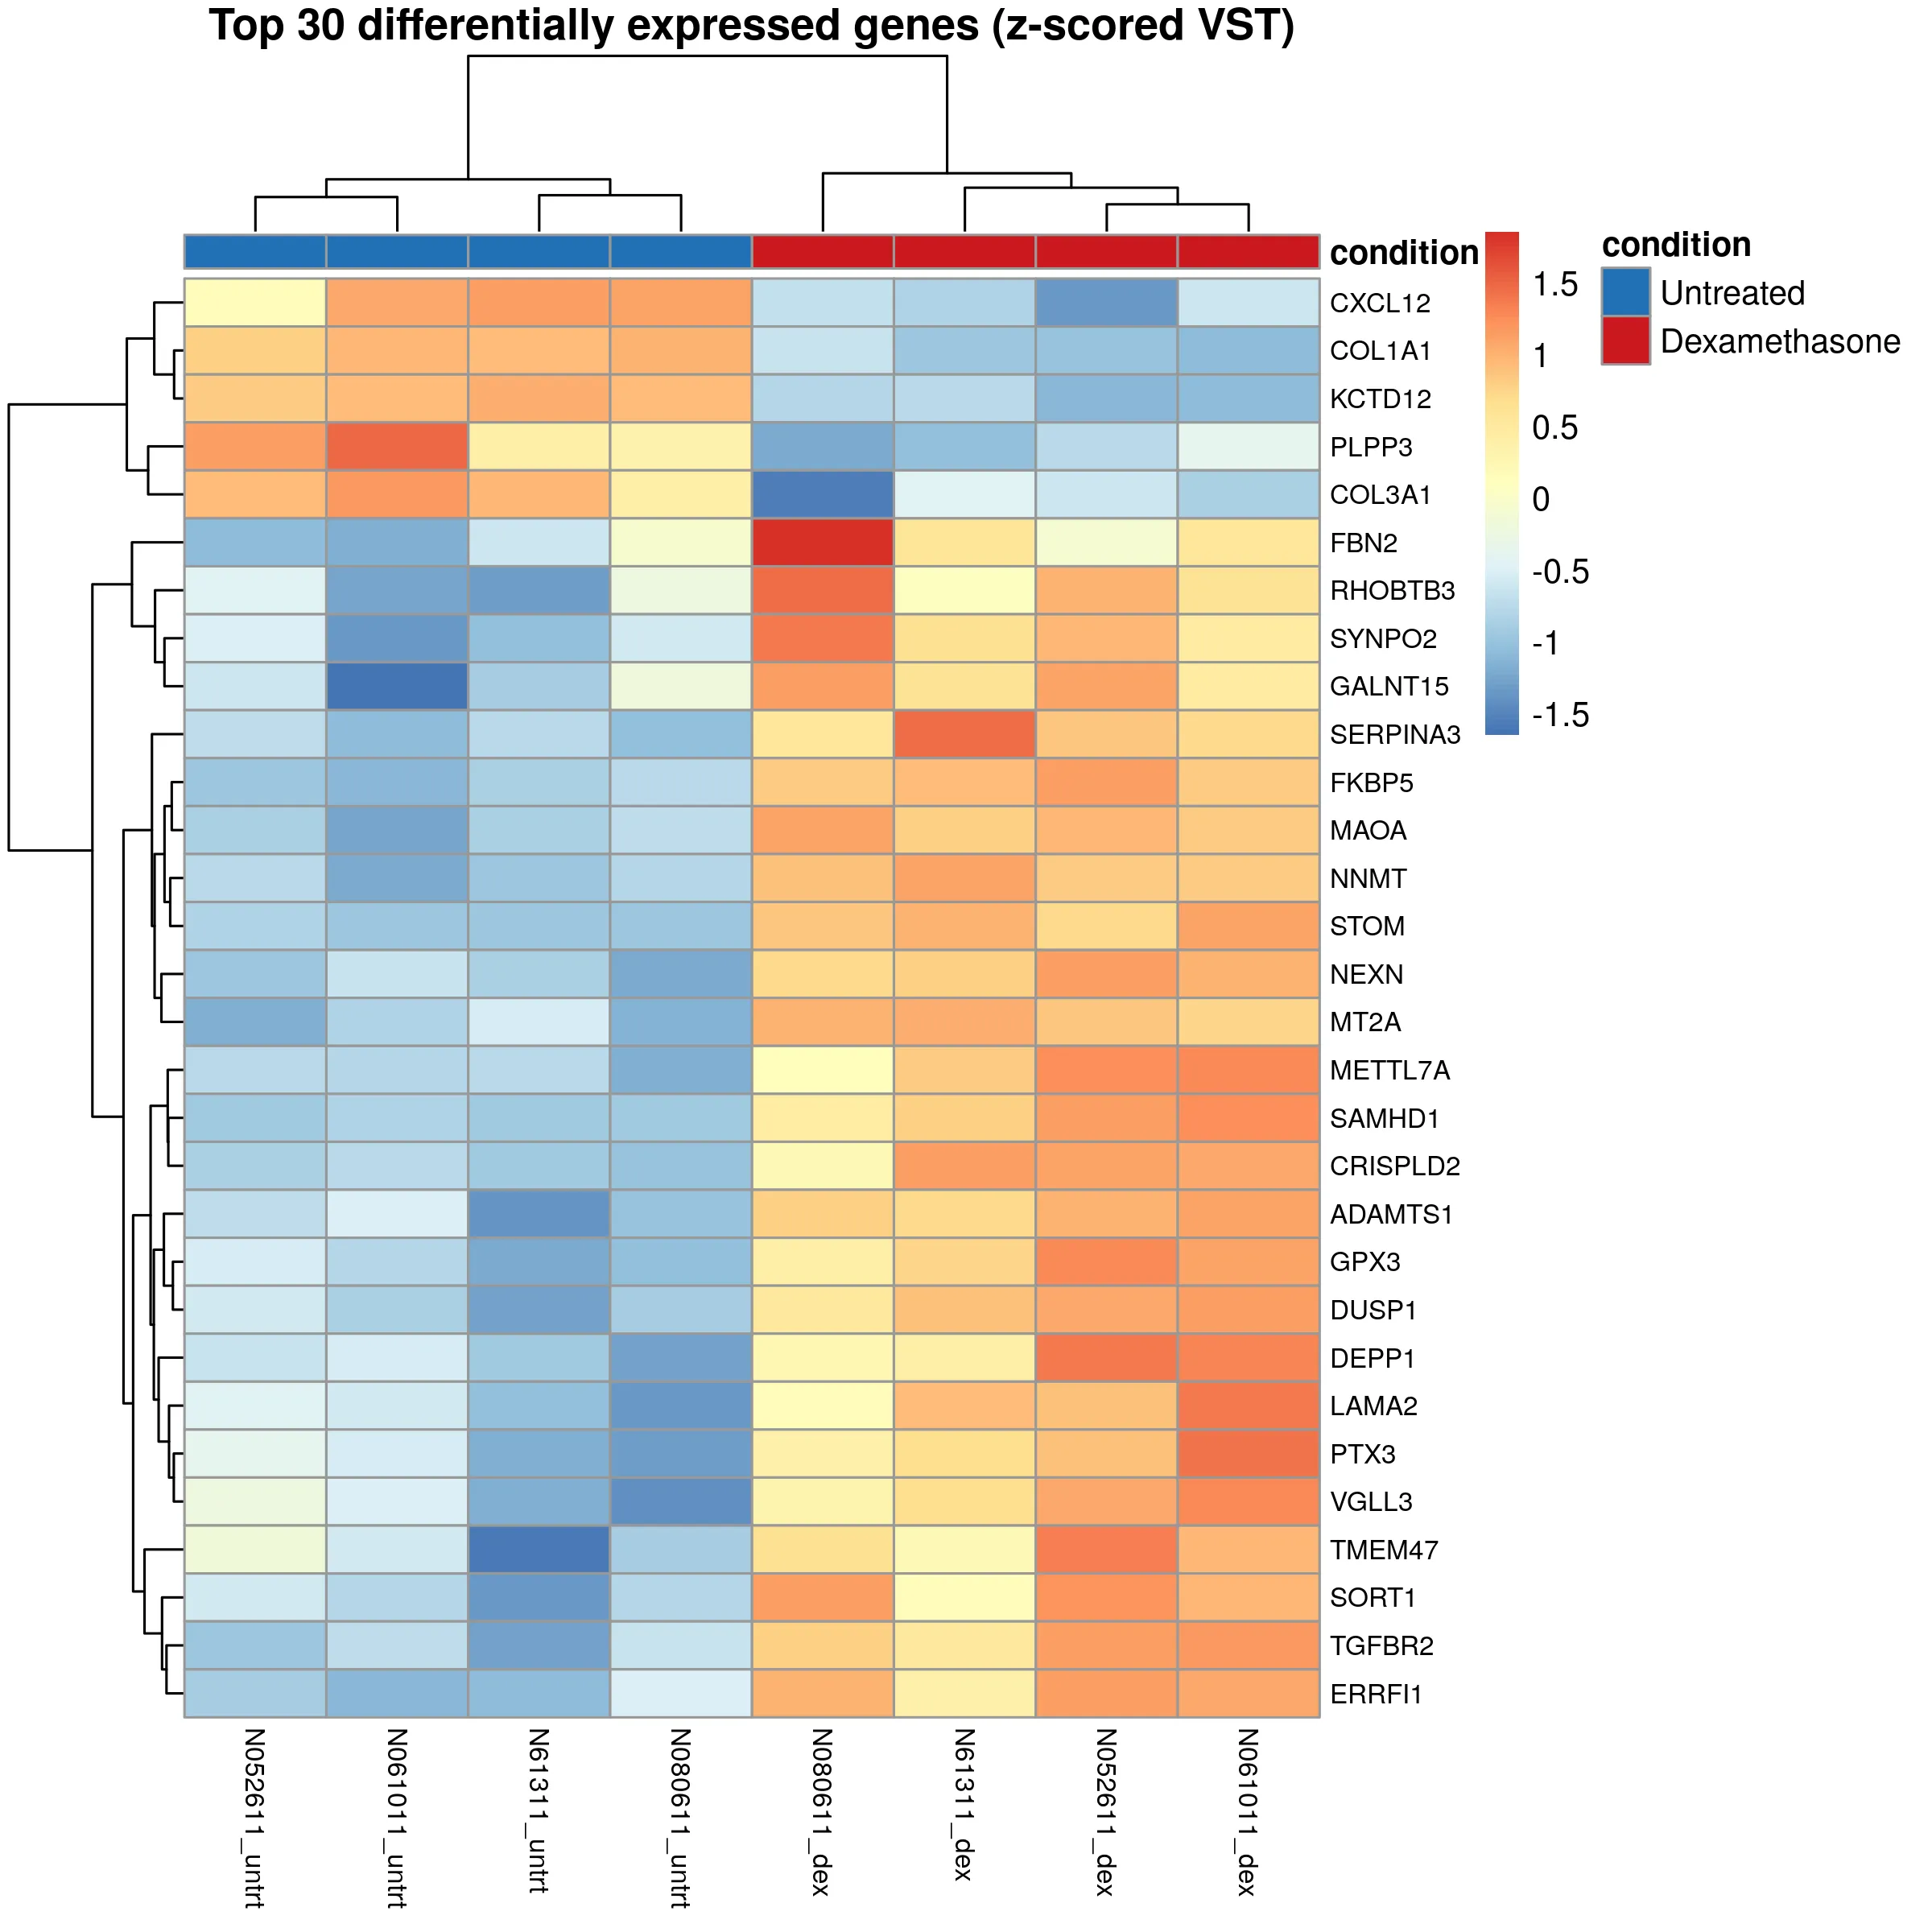
A heatmap of the 30 most significant genes shows consistent expression patterns across all four donors. Upregulated genes cluster in the treated samples, downregulated genes in the untreated samples.
Individual gene expression plots confirm robust treatment effects across donors:
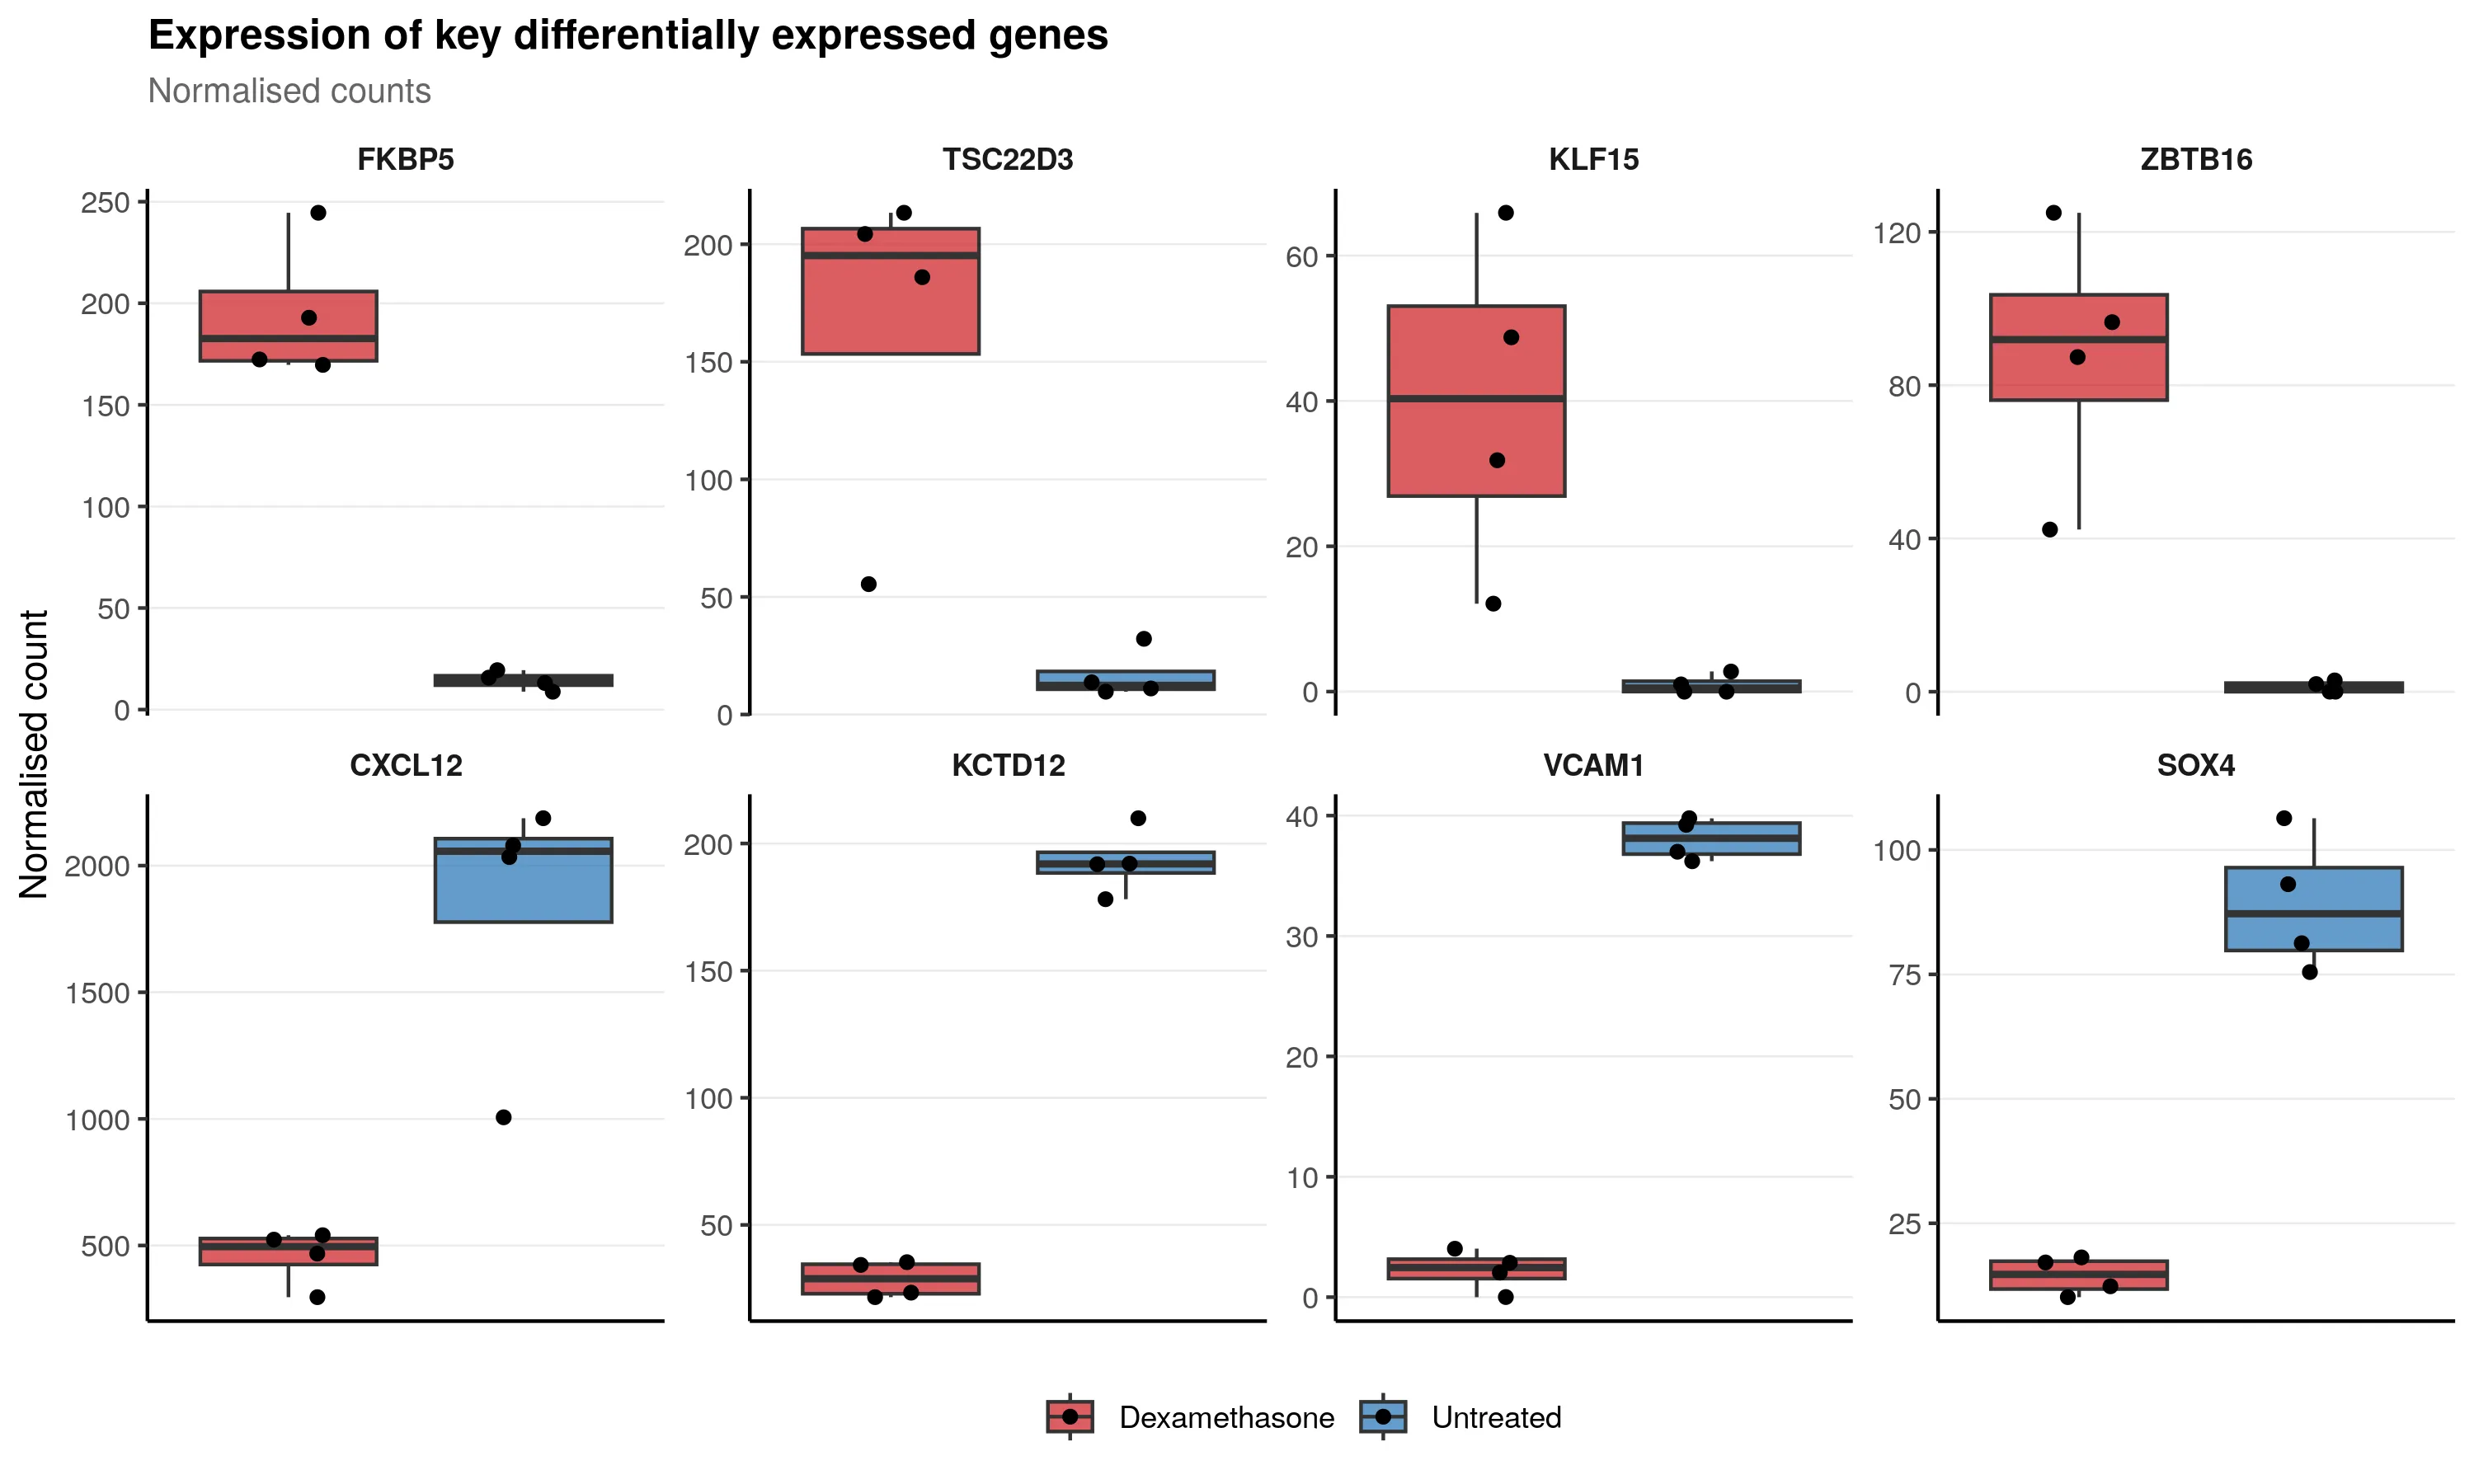
Key observations:
- FKBP5 and TSC22D3 show strong, consistent upregulation. These are canonical glucocorticoid response genes.
- KLF15 and ZBTB16 are transcription factors with pronounced dexamethasone-induced expression.
- CXCL12 and KCTD12 are consistently suppressed by treatment.
- VCAM1 and SOX4 show clear downregulation across all donors.
The Shiny report
Section titled “The Shiny report”The pipeline generates an interactive Shiny report at report/study.html. This self-contained HTML file lets you:
- Filter genes by fold change and p-value thresholds
- Search for specific genes by name
- Explore PCA plots interactively
- View pathway enrichment results from g:Profiler
Total cost for the full workflow
Section titled “Total cost for the full workflow”Here is the combined cost for both nf-core/rnaseq and nf-core/differentialabundance on the airway dataset:
| Item | Cost |
|---|---|
| rnaseq Spot compute (2.57 CPU-hours) | $0.041 |
| differentialabundance Spot compute (1.21 CPU-hours) | $0.019 |
| S3 storage (12.6 GB for 1 day) | $0.010 |
| S3 requests (~10k PUT + GET) | $0.027 |
| S3 egress (~120 MB download) | $0.011 |
| ECR image pulls | $0.004 |
| Total | $0.112 |
The entire analysis from raw FASTQ files to differential expression results cost 11 cents. Spot instances saved about 63% compared to on-demand pricing. Even a full-size dataset with 30 samples and full-depth sequencing would cost only a few dollars.
Connecting to downstream analysis
Section titled “Connecting to downstream analysis”The DESeq2 results from this pipeline can feed into the analysis workflows covered in the RNA-seq Analysis section of this site:
- DESeq2 in R: Load the normalized count matrix and run custom analyses beyond what the pipeline provides.
- pyDESeq2 in Python: Reproduce or extend the analysis in Python.
- ORA and GSEA: Take the ranked gene list and run pathway enrichment with clusterProfiler or fgsea.
The nf-core pipelines handle the compute-heavy steps. The downstream analysis in R or Python handles the interpretation and visualization.