RNA-seq with nf-core
This page walks through a complete run of nf-core/rnaseq on a real dataset using AWS Batch. You will download the data, prepare the samplesheet, configure the pipeline, run it, and explore the outputs.
The airway dataset
Section titled “The airway dataset”The airway dataset comes from Himes et al. 2014. The study measured gene expression in human airway smooth muscle cells treated with dexamethasone, a synthetic glucocorticoid used to treat asthma and other inflammatory conditions.
| Detail | Value |
|---|---|
| Organism | Homo sapiens |
| Tissue | Airway smooth muscle cells |
| Condition | Untreated vs. dexamethasone |
| Donors | 4 cell lines (paired design) |
| Samples | 8 (4 untreated + 4 treated) |
| Read type | 75 bp paired-end |
| GEO accession | GSE52778 |
This dataset is small enough to process cheaply but large enough to demonstrate a real workflow. It is also the standard teaching dataset in the Bioconductor ecosystem, so results can be cross-referenced with published analyses.
Downloading the data
Section titled “Downloading the data”Reference genome
Section titled “Reference genome”Download the GENCODE GRCh38 primary assembly and annotation:
# Genome sequencewget https://ftp.ebi.ac.uk/pub/databases/gencode/Gencode_human/release_44/GRCh38.primary_assembly.genome.fa.gz \  -O human_genome.fa.gz
# Transcriptomewget https://ftp.ebi.ac.uk/pub/databases/gencode/Gencode_human/release_44/gencode.v44.transcripts.fa.gz \  -O human_transcripts.fa.gz
# Gene annotationwget https://ftp.ebi.ac.uk/pub/databases/gencode/Gencode_human/release_44/gencode.v44.annotation.gtf.gz \  -O human_annotation.gtf.gz
FASTQ files
Section titled “FASTQ files”Download the 8 paired-end FASTQ files from SRA using fastq-dump:
# Install SRA Toolkitsudo yum install -y sra-tools  # Amazon Linux
# Download each sample (subsampled to 1M read pairs)for SRR in SRR1039508 SRR1039509 SRR1039512 SRR1039513 \           SRR1039516 SRR1039517 SRR1039520 SRR1039521; do  fastq-dump --split-files --gzip "$SRR"done
Each sample downloads as two files: SRR*_1.fastq.gz (read 1) and SRR*_2.fastq.gz (read 2). The total download is about 3 to 4 GB.
Upload to S3
Section titled “Upload to S3”Upload everything to your S3 bucket:
export S3_BUCKET=my-nfcore-bucket
aws s3 cp human_genome.fa.gz s3://$S3_BUCKET/data/airway/aws s3 cp human_transcripts.fa.gz s3://$S3_BUCKET/data/airway/aws s3 cp human_annotation.gtf.gz s3://$S3_BUCKET/data/airway/
for f in SRR*.fastq.gz; do  aws s3 cp "$f" s3://$S3_BUCKET/data/airway/fastq/done
Preparing the samplesheet
Section titled “Preparing the samplesheet”nf-core/rnaseq requires a CSV samplesheet that maps sample names to FASTQ file paths. Each row is one sample. The sample column groups technical replicates. The strandedness column tells Salmon how to handle strand information.
sample,fastq_1,fastq_2,strandednessN61311_untrt,s3://my-nfcore-bucket/data/airway/fastq/SRR1039508_1.fastq.gz,s3://my-nfcore-bucket/data/airway/fastq/SRR1039508_2.fastq.gz,unstrandedN61311_dex,s3://my-nfcore-bucket/data/airway/fastq/SRR1039509_1.fastq.gz,s3://my-nfcore-bucket/data/airway/fastq/SRR1039509_2.fastq.gz,unstrandedN052611_untrt,s3://my-nfcore-bucket/data/airway/fastq/SRR1039512_1.fastq.gz,s3://my-nfcore-bucket/data/airway/fastq/SRR1039512_2.fastq.gz,unstrandedN052611_dex,s3://my-nfcore-bucket/data/airway/fastq/SRR1039513_1.fastq.gz,s3://my-nfcore-bucket/data/airway/fastq/SRR1039513_2.fastq.gz,unstrandedN080611_untrt,s3://my-nfcore-bucket/data/airway/fastq/SRR1039516_1.fastq.gz,s3://my-nfcore-bucket/data/airway/fastq/SRR1039516_2.fastq.gz,unstrandedN080611_dex,s3://my-nfcore-bucket/data/airway/fastq/SRR1039517_1.fastq.gz,s3://my-nfcore-bucket/data/airway/fastq/SRR1039517_2.fastq.gz,unstrandedN061011_untrt,s3://my-nfcore-bucket/data/airway/fastq/SRR1039520_1.fastq.gz,s3://my-nfcore-bucket/data/airway/fastq/SRR1039520_2.fastq.gz,unstrandedN061011_dex,s3://my-nfcore-bucket/data/airway/fastq/SRR1039521_1.fastq.gz,s3://my-nfcore-bucket/data/airway/fastq/SRR1039521_2.fastq.gz,unstrandedThe sample names encode the cell line and treatment. N61311_untrt is donor N61311, untreated. N61311_dex is the same donor treated with dexamethasone.
Upload the samplesheet to S3:
aws s3 cp samplesheet.csv s3://$S3_BUCKET/data/airway/Pipeline parameters
Section titled “Pipeline parameters”nf-core/rnaseq accepts parameters as a JSON file. This keeps the run command clean and makes the analysis reproducible.
Create a file called airway.json:
{ "aligner": "star_salmon", "trimmer": "fastp", "gencode": true, "skip_gtf_filter": true}| Parameter | Value | Purpose |
|---|---|---|
aligner |
star_salmon |
Align with STAR, quantify with Salmon |
trimmer |
fastp |
Use fastp for adapter trimming |
gencode |
true |
Handle GENCODE GTF format correctly |
skip_gtf_filter |
true |
Skip GTF filtering step for GENCODE annotations |
The default aligner mode star_salmon aligns reads to the genome with STAR and then quantifies transcript abundance with Salmon using the aligned BAM files. This is different from Salmon’s standalone pseudo-alignment mode. STAR alignment gives you BAM files for visualization in a genome browser, while Salmon provides accurate transcript-level quantification.
Running the pipeline
Section titled “Running the pipeline”With data on S3, the samplesheet uploaded, and the AWS Batch infrastructure from the previous page in place, run the pipeline:
nextflow run nf-core/rnaseq \ -r 3.14.0 \ -profile docker \ -c aws.config \ -params-file airway.json \ --input 's3://my-nfcore-bucket/data/airway/samplesheet.csv' \ --fasta 's3://my-nfcore-bucket/data/airway/human_genome.fa.gz' \ --transcript_fasta 's3://my-nfcore-bucket/data/airway/human_transcripts.fa.gz' \ --gtf 's3://my-nfcore-bucket/data/airway/human_annotation.gtf.gz' \ --outdir 's3://my-nfcore-bucket/results/rnaseq/airway'Nextflow prints a progress table as tasks complete:
executor > awsbatch (55)[77/a1b2c3] NFCORE_RNASEQ:RNASEQ:FASTQ_FASTQC_UMITOOLS_FASTP:FASTQC_RAW (N61311_untrt) [100%] 8 of 8 ✔[e4/d5f6a7] NFCORE_RNASEQ:RNASEQ:FASTQ_FASTQC_UMITOOLS_FASTP:FASTP (N61311_untrt) [100%] 8 of 8 ✔[b8/c9d0e1] NFCORE_RNASEQ:RNASEQ:ALIGN_STAR:STAR_ALIGN (N61311_untrt) [100%] 8 of 8 ✔[f2/a3b4c5] NFCORE_RNASEQ:RNASEQ:QUANTIFY_SALMON:SALMON_QUANT (N61311_untrt) [100%] 8 of 8 ✔...Execution stats
Section titled “Execution stats”This run completed with these statistics:
| Metric | Value |
|---|---|
| Duration | 53 minutes 48 seconds |
| Tasks | 55 succeeded, 1 retried |
| CPU-hours | 3.1 |
| Executor | AWS Batch Spot (c5, m5 families) |
The single retried task was automatically resubmitted by Nextflow. Retries happen occasionally with Spot instances and are handled transparently.
Output files
Section titled “Output files”The pipeline writes results to the S3 output directory. Download the key files:
# Count matrix (main output for downstream analysis)aws s3 cp s3://my-nfcore-bucket/results/rnaseq/airway/star_salmon/salmon.merged.gene_counts.tsv .
# TPM valuesaws s3 cp s3://my-nfcore-bucket/results/rnaseq/airway/star_salmon/salmon.merged.gene_tpm.tsv .
# MultiQC reportaws s3 cp s3://my-nfcore-bucket/results/rnaseq/airway/multiqc/multiqc_report.html .
# Transcript-to-gene mappingaws s3 cp s3://my-nfcore-bucket/results/rnaseq/airway/star_salmon/tx2gene.tsv .
The count matrix
Section titled “The count matrix”The most important output is the gene count matrix. This file has one row per gene and one column per sample:
gene_id gene_name N052611_dex N052611_untrt N061011_dex N061011_untrt N080611_dex N080611_untrt N61311_dex N61311_untrtENSG00000000003.16 TSPAN6 24 40 30 33 47 38 14 22ENSG00000000005.6 TNMD 0 0 0 0 0 0 0 0ENSG00000000419.14 DPM1 25 20 18 22 18 20 28 14ENSG00000000457.14 SCYL3 10 12 19 11 11 7 12 11The gene_id column uses Ensembl IDs with version numbers. The gene_name column has the human-readable symbol. Count values are raw, unnormalized counts from Salmon. These are the input for DESeq2 or other differential expression tools.
Other output files
Section titled “Other output files”| File | Description |
|---|---|
salmon.merged.gene_tpm.tsv |
Transcripts per million, normalized for gene length and library size |
salmon.merged.gene_counts_length_scaled.tsv |
Counts adjusted for transcript length bias |
salmon.merged.gene_lengths.tsv |
Effective gene lengths estimated by Salmon |
tx2gene.tsv |
Mapping from transcript IDs to gene IDs |
multiqc/multiqc_report.html |
Interactive QC report combining all pipeline metrics |
The MultiQC report
Section titled “The MultiQC report”The MultiQC report is an interactive HTML file that summarizes every quality metric from the pipeline. Open it in a browser to check:
- FastQC results: per-sample read quality, adapter content, GC distribution
- fastp trimming stats: how many reads and bases were trimmed
- STAR alignment rates: percentage of reads mapped uniquely, multi-mapped, or unmapped
- Salmon quantification: number of reads assigned to transcripts
- Duplicate rates: PCR duplication levels per sample
- Gene body coverage: whether reads cover the full length of genes or are biased toward the 3’ or 5’ end
If any sample looks like an outlier in the MultiQC report, investigate before proceeding to differential expression.
Sample quality: PCA and distance heatmap
Section titled “Sample quality: PCA and distance heatmap”Beyond the MultiQC report, the pipeline also produces exploratory plots from DESeq2’s variance-stabilized counts. These help you spot batch effects or outlier samples before running differential expression.
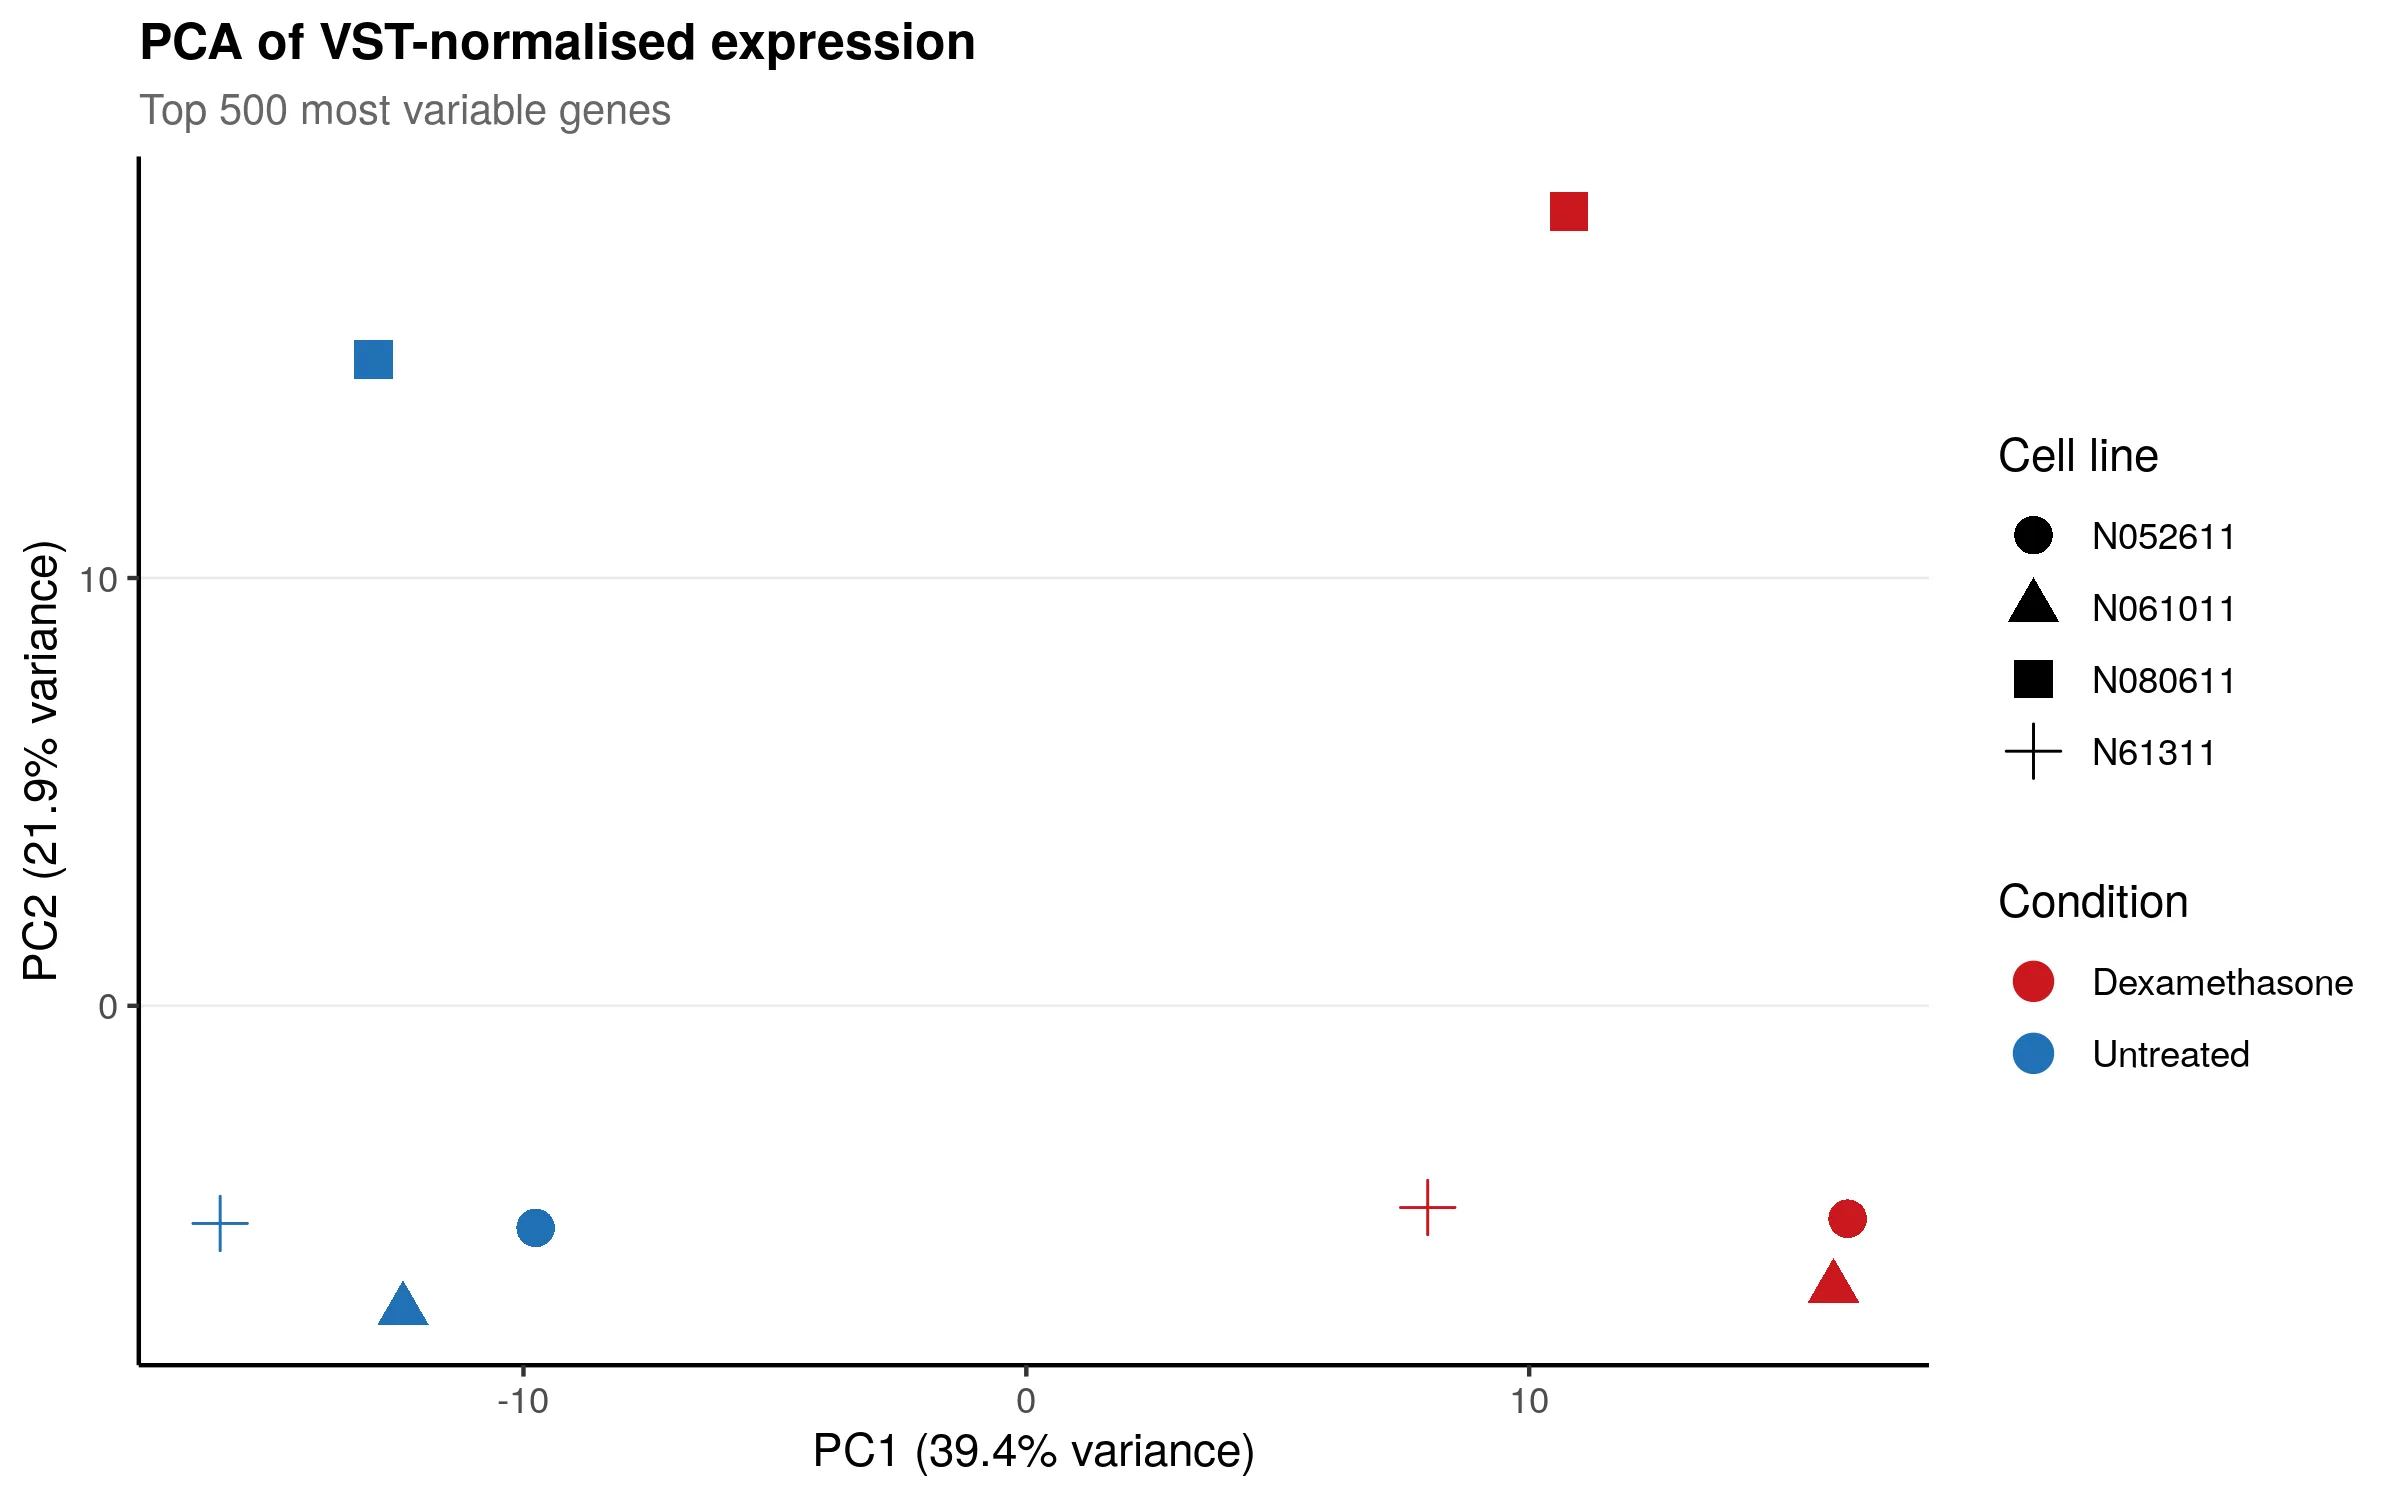
The PCA plot below shows how the 8 samples cluster. The dominant source of variation (PC1) is donor identity, which is expected in a paired design. The dexamethasone treatment effect separates samples along PC2.
The sample distance heatmap confirms that paired samples from the same cell line are most similar. This validates using cell_line as a blocking factor in the DESeq2 model.
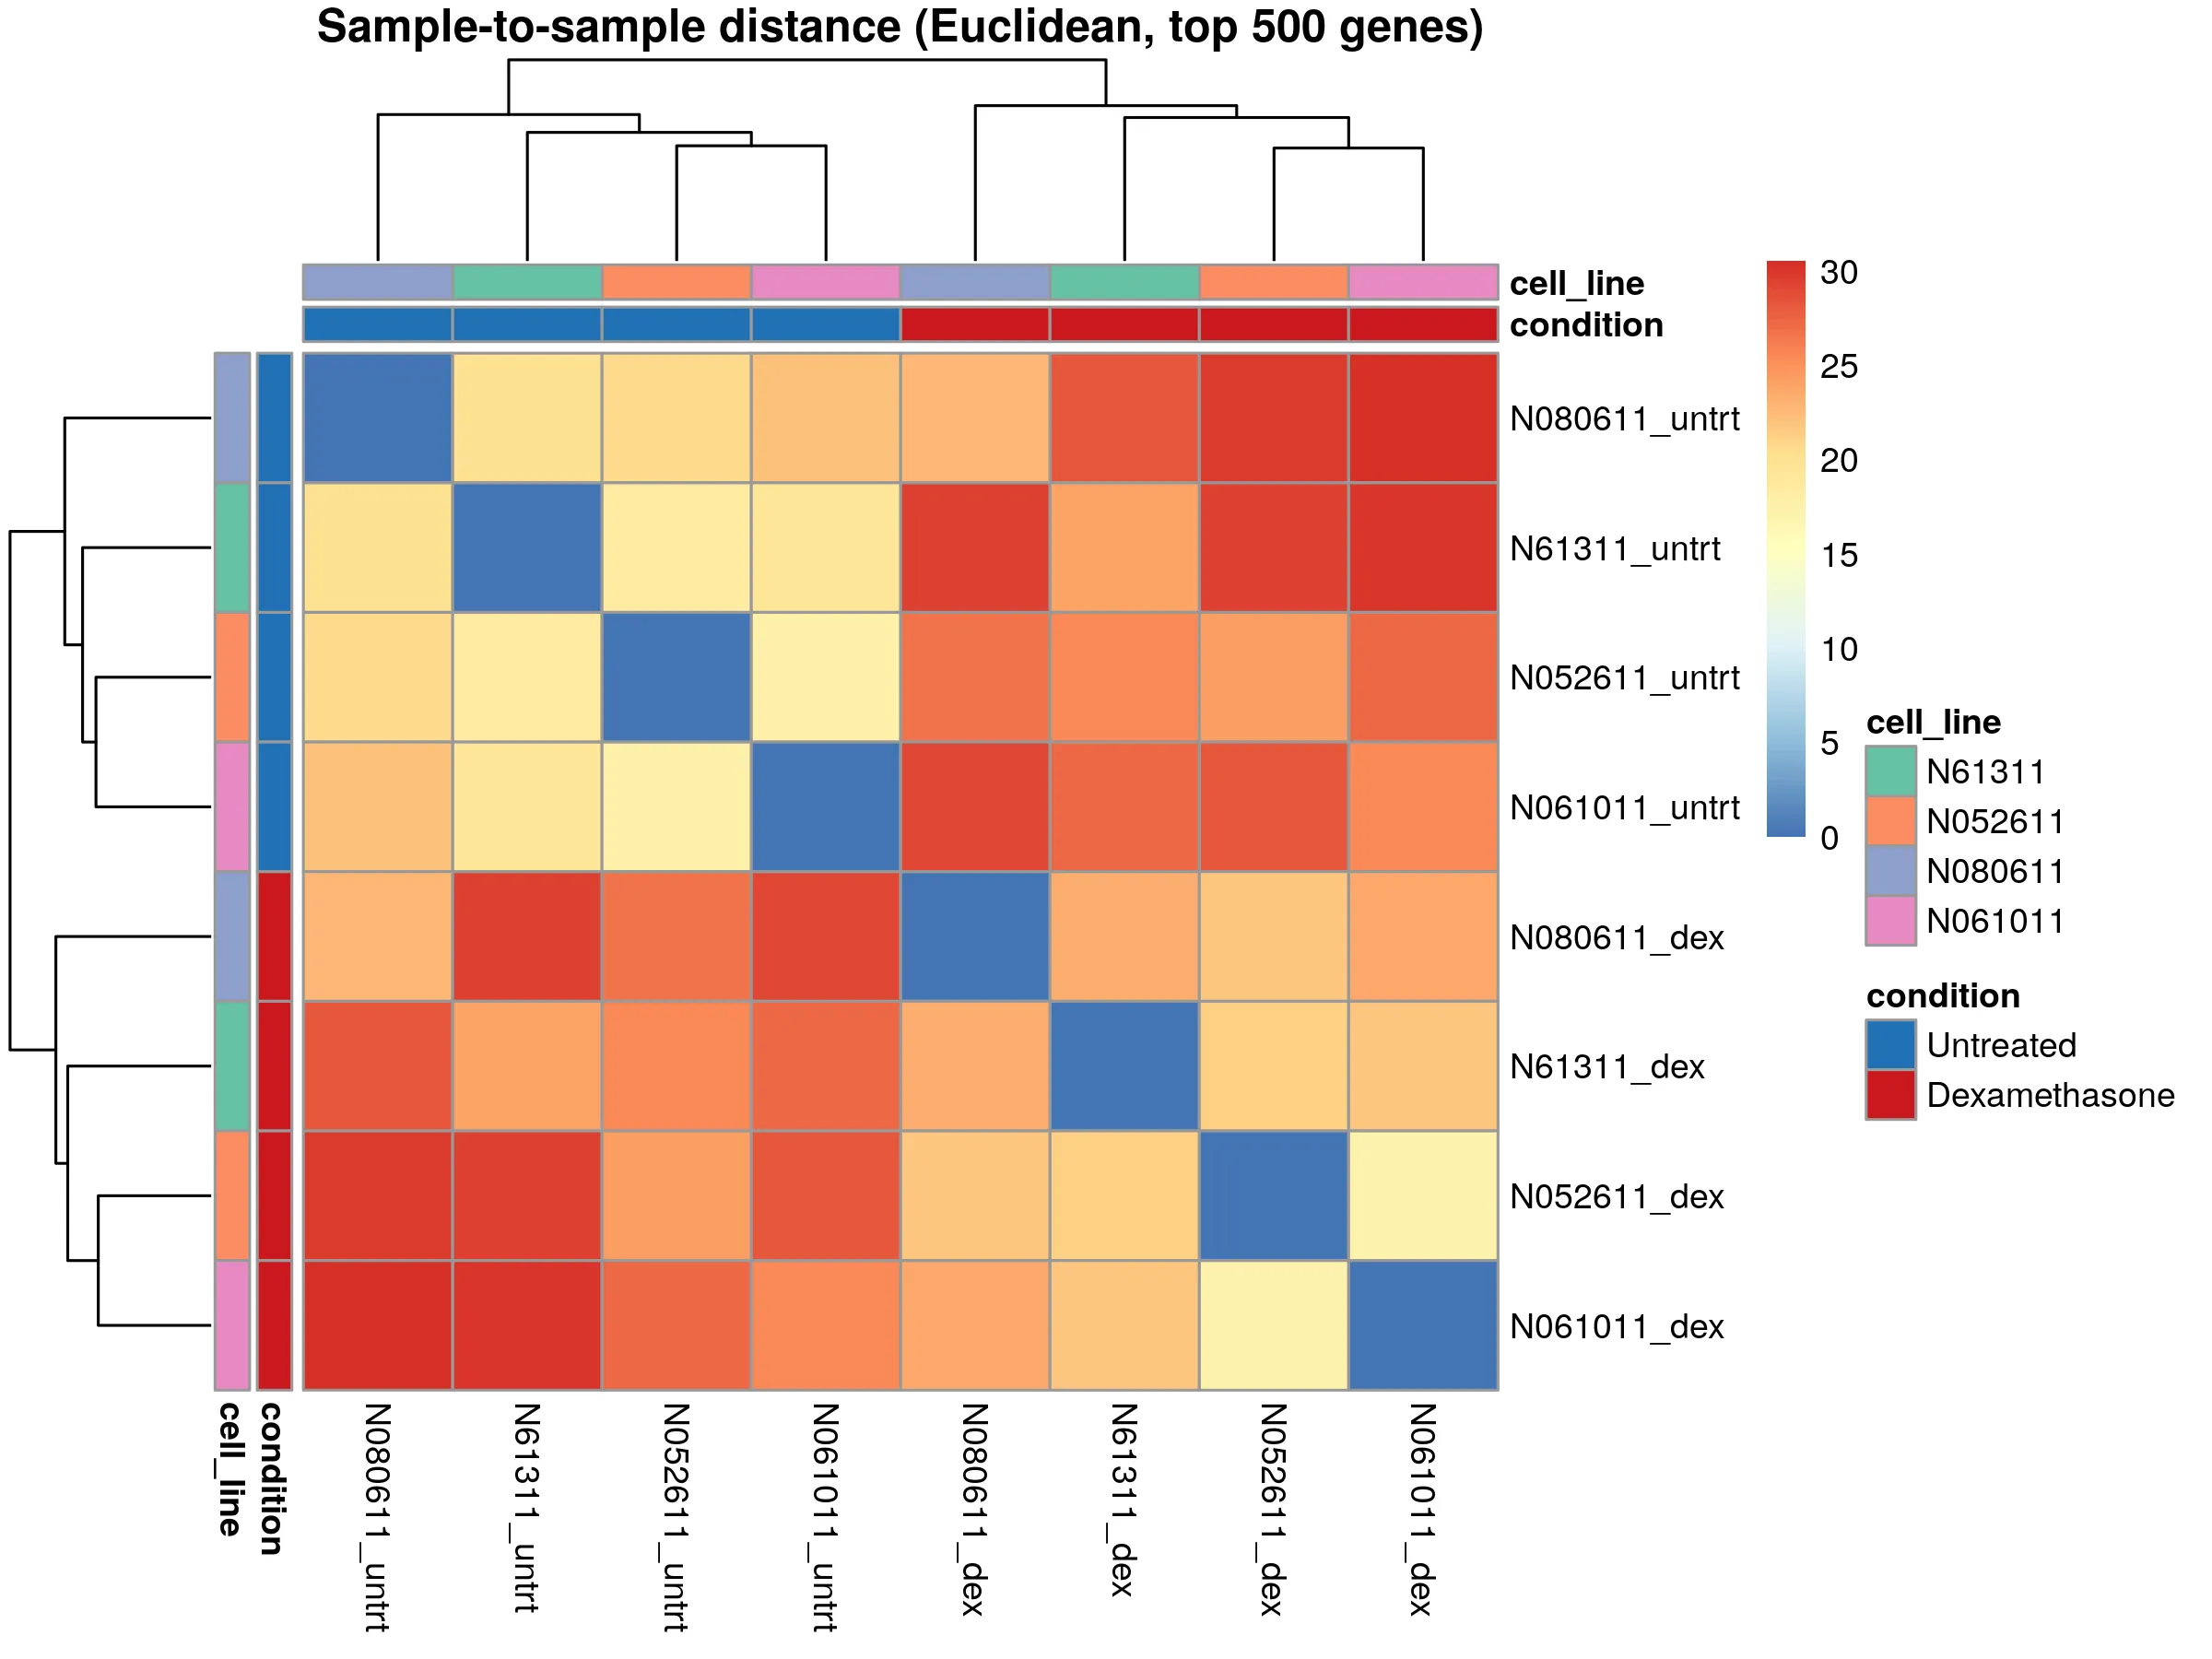
Both plots look clean. No outlier samples, no unexpected batch effects. The data is ready for differential expression analysis.
The nf-core/rnaseq run on 8 subsampled airway samples cost $0.041 in Spot compute. The head node ran for about an hour on a t3.medium at $0.04/hr. Total compute cost for this step: under 10 cents.
Next steps
Section titled “Next steps”The count matrix is ready for differential expression analysis. The next page covers running nf-core/differentialabundance to identify genes that respond to dexamethasone treatment.