Integration
Two datasets, one batch each
Section titled “Two datasets, one batch each”import numpy as npimport scanpy as scimport matplotlib.pyplot as plt
sc.settings.verbosity = 3np.random.seed(42)
pbmc3k = sc.read_10x_mtx("/opt/data/pbmc3k", var_names="gene_symbols", make_unique=True)pbmc3k.obs["sample"] = "pbmc3k"
pbmc10k = sc.read_10x_mtx("/opt/data/pbmc10k", var_names="gene_symbols", make_unique=True)pbmc10k.obs["sample"] = "pbmc10k"
# Concatenate the two matrices. join="inner" keeps the genes both# chemistries measured.adata = sc.concat([pbmc3k, pbmc10k], join="inner")adata.layers["counts"] = adata.X.copy()
print(adata)print(adata.obs["sample"].value_counts())AnnData object with n_obs × n_vars = 14469 × 20453 obs: 'sample' layers: None (.X), 'counts'samplepbmc10k 11769pbmc3k 2700Name: count, dtype: int64Quality control per sample
Section titled “Quality control per sample”# sc-best-practices runs the QC metrics per batch, never on the# aggregated data.adata.var["mt"] = adata.var_names.str.startswith("MT-")sc.pp.calculate_qc_metrics(adata, qc_vars=["mt"], percent_top=None, log1p=False, inplace=True)adata.obs["log1p_total_counts"] = np.log1p(adata.obs["total_counts"])adata.obs["log1p_n_genes_by_counts"] = np.log1p( adata.obs["n_genes_by_counts"])
def is_outlier(adata, metric, nmads): """Flag cells whose metric sits more than nmads MADs from the median.
Args: adata: AnnData object holding the metric in .obs. metric: Column of adata.obs to test. nmads: Number of median absolute deviations for the cutoff.
Returns: Boolean Series, True where the cell is an outlier. """ values = adata.obs[metric] median = values.median() mad = (values - median).abs().median() return (values < median - nmads * mad) | (values > median + nmads * mad)
adata.obs["outlier"] = Falsefor sample in ("pbmc3k", "pbmc10k"): mask = adata.obs["sample"] == sample subset = adata[mask] outliers = ( is_outlier(subset, "log1p_total_counts", 5) | is_outlier(subset, "log1p_n_genes_by_counts", 5) | is_outlier(subset, "pct_counts_mt", 3) ) adata.obs.loc[mask, "outlier"] = outliers.values
print(adata.obs.groupby("sample")["outlier"].value_counts())adata = adata[~adata.obs["outlier"]].copy()sc.pp.filter_genes(adata, min_cells=3)print("after filtering:", adata.shape)sample outlierpbmc10k False 10271 True 1498pbmc3k False 2427 True 273Name: count, dtype: int64after filtering: (12698, 15244)See the batch effect before correcting it
Section titled “See the batch effect before correcting it”sc.pp.normalize_total(adata, target_sum=1e4)sc.pp.log1p(adata)sc.pp.highly_variable_genes(adata, layer="counts", n_top_genes=2000, flavor="seurat_v3")adata.raw = adataadata = adata[:, adata.var["highly_variable"]]sc.pp.scale(adata, max_value=10)sc.tl.pca(adata, n_comps=50, random_state=42)sc.pp.neighbors(adata, n_neighbors=15, n_pcs=30, random_state=42)sc.tl.umap(adata, random_state=42)
def same_batch_neighbor_fraction(adata): """Return the mean fraction of each cell's graph weight on its own batch.
Args: adata: AnnData object with a neighbor graph and a batch column.
Returns: The mean over cells of the same-batch share of graph weights. """ connectivities = adata.obsp["connectivities"].toarray() batches = adata.obs["sample"].to_numpy() same = batches[:, None] == batches[None, :] own = (connectivities * same).sum(axis=1) total = connectivities.sum(axis=1) return float(np.mean(own / total))
share = (adata.obs["sample"] == "pbmc3k").mean()print(f"pbmc3k share of cells: {share:.3f}")print(f"uncorrected same-batch fraction: " f"{same_batch_neighbor_fraction(adata):.3f}")pbmc3k share of cells: 0.191uncorrected same-batch fraction: 0.997sc.pl.umap(adata, color="sample", show=False)plt.savefig("outputs/integration_uncorrected.png", dpi=150, bbox_inches="tight")plt.close()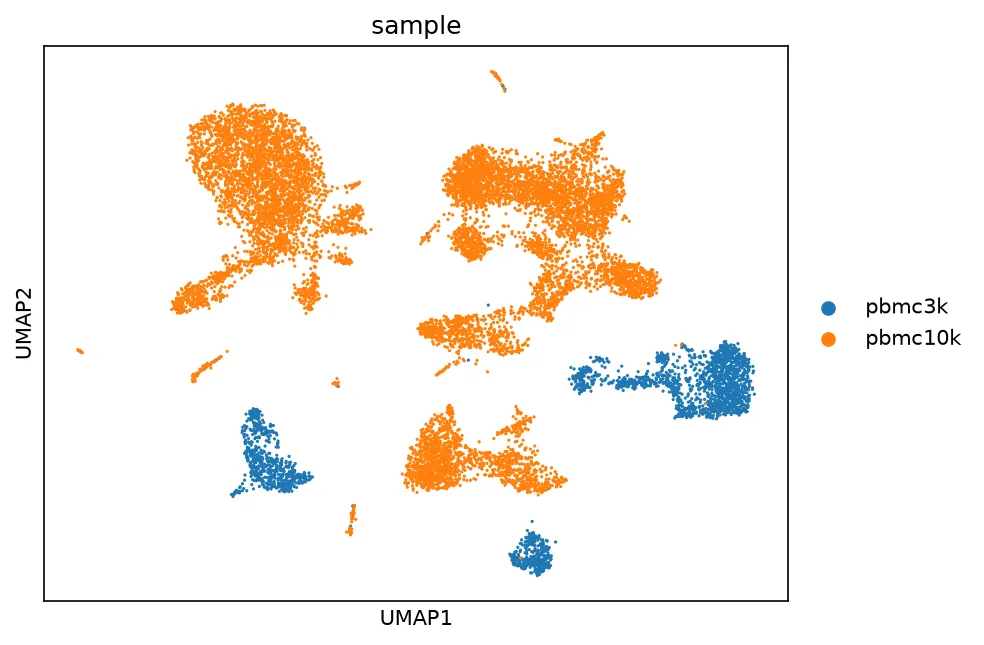
Harmony
Section titled “Harmony”import harmonypy as hm
# Harmony adjusts the PCA embedding so the batches align, keeping the# neighbor graph structure.ho = hm.run_harmony(np.array(adata.obsm["X_pca"]), adata.obs, "sample", max_iter_harmony=20, verbose=False, random_state=42)adata.obsm["X_harmony"] = ho.Z_corr
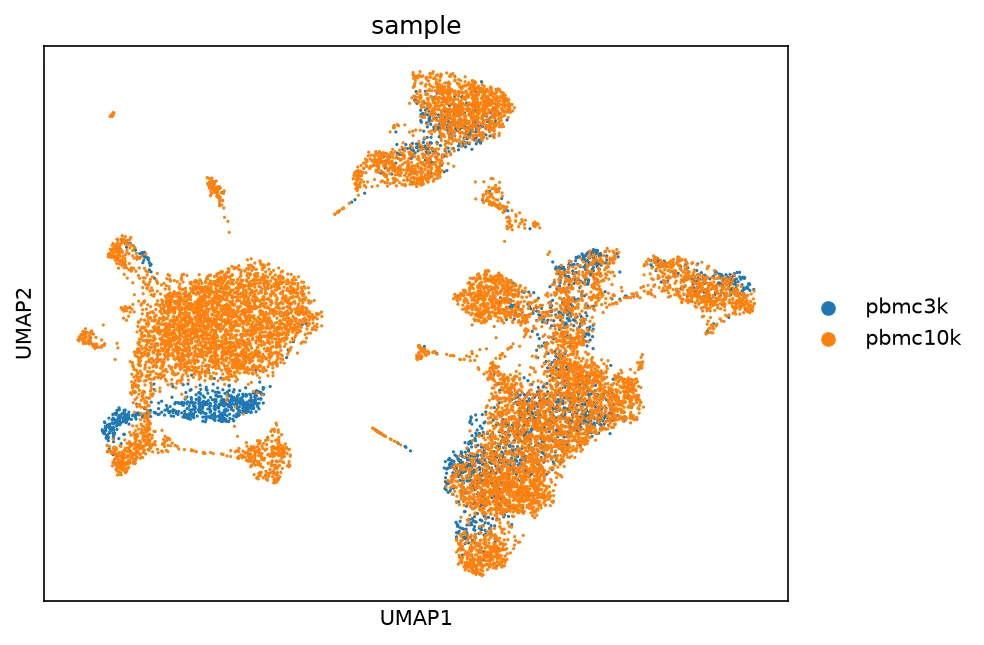
sc.pp.neighbors(adata, use_rep="X_harmony", n_neighbors=15, random_state=42)sc.tl.umap(adata, random_state=42)print(f"harmony same-batch fraction: " f"{same_batch_neighbor_fraction(adata):.3f}")harmony same-batch fraction: 0.804sc.pl.umap(adata, color="sample", show=False)plt.savefig("outputs/integration_harmony.png", dpi=150, bbox_inches="tight")plt.close()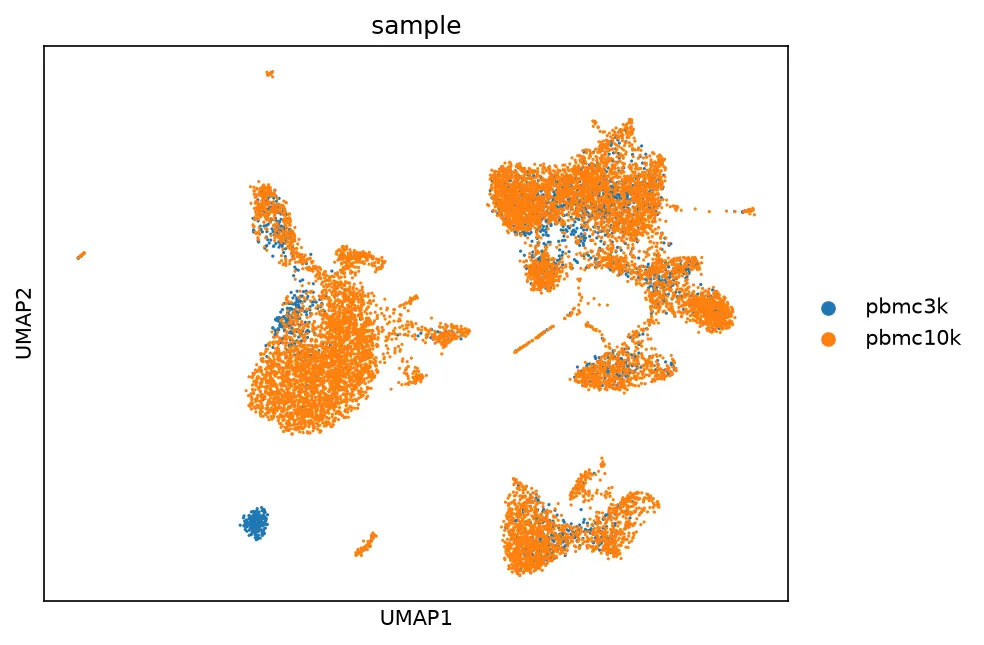
import scvi
# scVI learns a latent embedding with a neural network that models the# counts directly and removes the batch effect it is told about. The# training runs on CPU here, so the epoch count stays small, and the# progress bar is off so the run prints its result and nothing else.scvi.settings.seed = 42scvi.model.SCVI.setup_anndata(adata, layer="counts", batch_key="sample")model = scvi.model.SCVI(adata, n_latent=10)model.train(max_epochs=50, enable_progress_bar=False)
adata.obsm["X_scVI"] = model.get_latent_representation()sc.pp.neighbors(adata, use_rep="X_scVI", n_neighbors=15, random_state=42)sc.tl.umap(adata, random_state=42)print(f"scVI same-batch fraction: "      f"{same_batch_neighbor_fraction(adata):.3f}")
scVI same-batch fraction: 0.875sc.pl.umap(adata, color="sample", show=False)plt.savefig("outputs/integration_scvi.png", dpi=150, bbox_inches="tight")plt.close()