Categorical Data (Chi-square & Fisher)
Not every variable is a number. Mutation status, treatment response, cell type, and sex are categories. To ask whether two categories are associated, you build a contingency table and test it. This page asks whether a mutation is associated with treatment response, in R and Python.
Every code block on this page runs in a container in the companion repository. The numbers and figure come from those real runs.
When to use each test
Section titled “When to use each test”Both tests ask the same question: are the two categories independent, or associated?
- Chi-square test. The default for larger tables and larger counts.
- Fisher’s exact test. Exact, and the right choice when any expected count is small, roughly under 5. Always safe for a 2x2 table.
The data
Section titled “The data”patients.csv has 50 patients, each with a mutation status (mutant or wildtype)
and a response (responder or non-responder).
df <- read.csv("patients.csv")tab <- table(df$mutation, df$response)tab non_responder responder mutant 7 18 wildtype 16 9import pandas as pd
df = pd.read_csv("patients.csv")tab = pd.crosstab(df["mutation"], df["response"])tabresponse non_responder respondermutationmutant 7 18wildtype 16 9The table already tells a story. Among mutants, 18 of 25 responded (72%). Among wild-type, only 9 of 25 responded (36%). A stacked bar makes the gap obvious, with the chi-square p-value printed on top (the test itself is the next section).
library(ggplot2)
ggplot(df, aes(x = mutation, fill = response)) +  geom_bar(position = "fill") +  labs(y = "Proportion", fill = "Response",       subtitle = sprintf("Chi-square p = %.3f", chisq.test(tab)$p.value))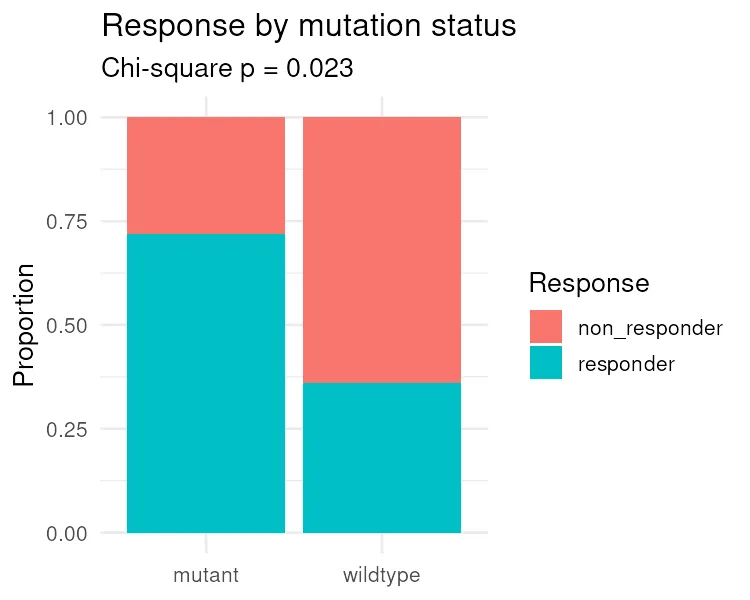
from scipy import stats
p = stats.chi2_contingency(tab)[1]ax = prop.plot(kind="bar", stacked=True)ax.set_title(f"Response by mutation status\n(chi-square p = {p:.3f})")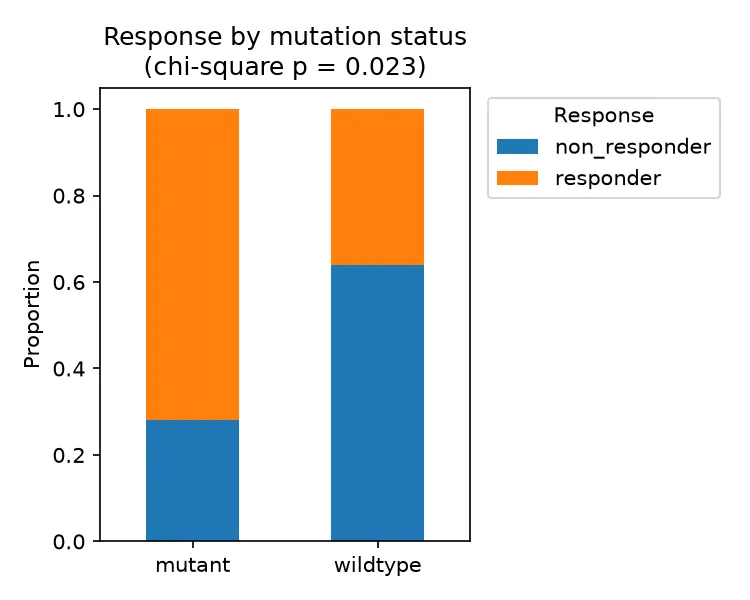
Chi-square test
Section titled “Chi-square test”The chi-square test compares the counts you observed with the counts you would expect if mutation and response were independent. A large statistic, and small p-value, means they are not independent.
chisq.test(tab) Pearson's Chi-squared test with Yates' continuity correctiondata: tabX-squared = 5.153, df = 1, p-value = 0.02321from scipy import stats
chi2, p, dof, expected = stats.chi2_contingency(tab)print(chi2, p)Chi-square: X2 = 5.153, dof = 1, p = 2.321e-02Both give X squared = 5.15 and p = 0.023. Mutation and response are associated. Both apply Yates’ continuity correction for the 2x2 table by default, which is why the numbers match exactly.
Fisher’s exact test
Section titled “Fisher’s exact test”For a 2x2 table, especially with modest counts, Fisher’s exact test gives an exact p-value rather than an approximation.
fisher.test(tab) Fisher's Exact Test for Count Datadata: tabp-value = 0.02224sample estimates:odds ratio 0.2261644odds, p = stats.fisher_exact(tab)print(odds, p)Fisher: sample odds ratio = 0.219, p = 2.224e-02The exact p-value, 0.022, matches across languages. The odds ratio does not match
exactly, and that is not a bug. R’s fisher.test reports the conditional maximum
likelihood odds ratio (0.226), while scipy reports the plain sample odds ratio
(0.219). They estimate the same association with different conventions and tell the
same story. An odds ratio below 1 here reflects the table orientation: the odds of
non-response are lower in mutants, which is the same as saying mutants respond more.
Pitfalls and bioinformatics notes
Section titled “Pitfalls and bioinformatics notes”- Use Fisher for small counts. When an expected cell count drops below about 5, the chi-square approximation is unreliable. Fisher’s exact test is safe.
- Test counts, not proportions. Both tests need the raw counts. Feeding in percentages loses the sample size and breaks the test.
- Association is not direction. A significant test says the variables are linked. Read the table or the odds ratio to see which way.
- Watch the odds-ratio convention. R and Python report different odds-ratio estimators for Fisher’s test. Quote the p-value, and state which odds ratio you used.
Key points
Section titled “Key points”- A contingency table plus a chi-square or Fisher test asks whether two categories are associated.
- Chi-square suits larger counts; Fisher’s exact test is safe for small counts and 2x2 tables.
- The p-values match across R and Python; the Fisher odds-ratio estimate differs by convention.
Further reading
Section titled “Further reading”- STHDA, chi-square test of independence and Fisher’s exact test.
- The next guide, Correlation, for association between two numeric variables.