Multiple Groups (ANOVA & Kruskal-Wallis)
When you have three or more groups, the temptation is to run a t-test on every pair. That inflates the false-positive rate fast. Analysis of variance, or ANOVA, asks one question instead: do any of the group means differ? This page compares expression across a control and two drug doses, in R and Python.
Every code block on this page runs in a container in the companion repository. The numbers and figure come from those real runs.
When to use ANOVA
Section titled “When to use ANOVA”Use ANOVA when you compare the means of three or more groups on a roughly normal outcome. It controls the overall false-positive rate that many separate t-tests would blow through. If the outcome is not normal, use its rank-based cousin, the Kruskal-Wallis test, shown at the end.
The data
Section titled “The data”group_expression.csv has 45 samples split evenly across three groups: control,
drug_low, and drug_high.
df <- read.csv("group_expression.csv")df$group <- factor(df$group, levels = c("control", "drug_low", "drug_high"))import pandas as pd
df = pd.read_csv("group_expression.csv")A boxplot is the right first look. The high dose sits well above the other two. The
brackets show the pairwise Tukey comparisons, explained in the post-hoc section below:
ns means not significant, and each * is a tighter significance threshold.
library(ggpubr)   # ggboxplot + stat_pvalue_manual (attaches ggplot2)library(rstatix)  # tukey_hsd() + add_xy_position()
tukey <- add_xy_position(tukey_hsd(df, expression ~ group), x = "group")
ggboxplot(df, x = "group", y = "expression", fill = "group",          palette = c("#e07a5f", "#81b29a", "#4c72b0"), add = "jitter") +  stat_pvalue_manual(tukey, label = "p.adj.signif")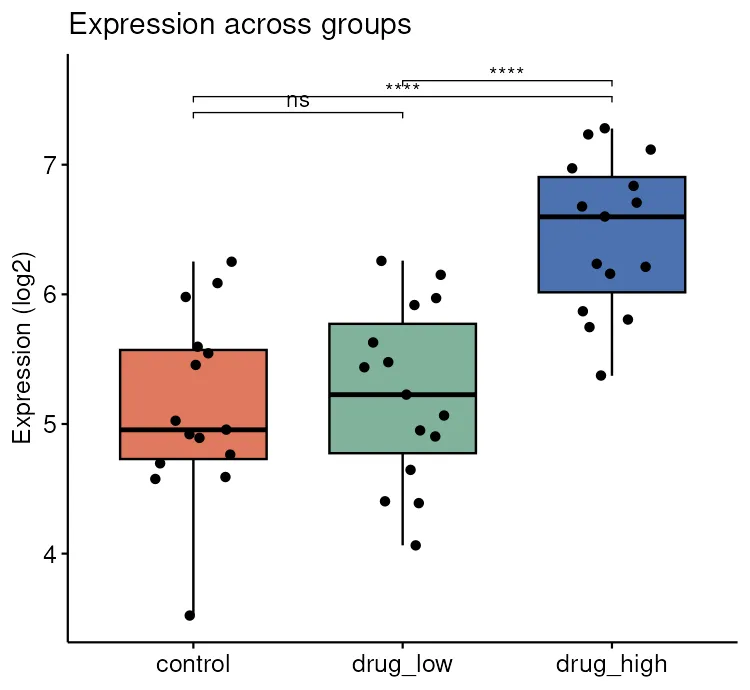
import itertoolsimport seaborn as snsfrom statsmodels.stats.multicomp import pairwise_tukeyhsd
ax = sns.boxplot(    data=df,    x="group",    y="expression",    hue="group",    legend=False,    width=0.5,    fliersize=0,)sns.stripplot(data=df,              x="group",              y="expression",              color="black",              alpha=0.6,              ax=ax)
# Draw a bracket for each pair at a staggered height.# Label it with significance stars from the Tukey adjusted p values.# The full helper is in the companion repository.tukey = pairwise_tukeyhsd(df["expression"], df["group"])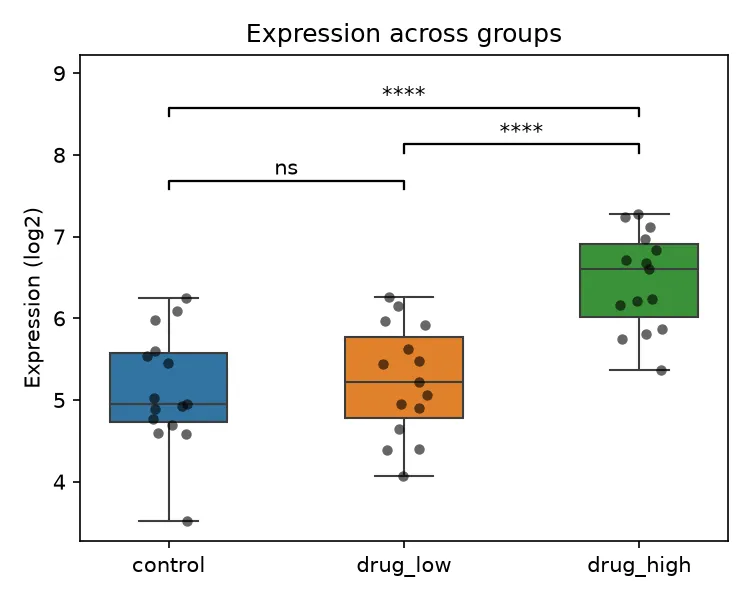
One-way ANOVA
Section titled “One-way ANOVA”ANOVA splits the total variation into the part explained by the groups and the part left over. The F statistic is their ratio. A large F, and a small p-value, means the groups explain more than chance would.
fit <- aov(expression ~ group, data = df)summary(fit) Df Sum Sq Mean Sq F value Pr(>F)group 2 16.39 8.196 18.67 1.58e-06 ***Residuals 42 18.43 0.439from scipy import stats
groups = [df.loc[df["group"] == g, "expression"] for g in df["group"].unique()]stats.f_oneway(*groups)ANOVA: F = 18.672, p = 1.579e-06Both give F = 18.67 and p = 1.6e-06. At least one group differs. But ANOVA does not say which one. For that you need a post-hoc test.
Which groups differ? Tukey’s HSD
Section titled “Which groups differ? Tukey’s HSD”Tukey’s Honest Significant Difference compares every pair while holding the overall error rate at 5%. It reports the difference in means and an adjusted p-value for each pair.
TukeyHSD(fit) diff lwr upr p adjdrug_low-control 0.108000 -0.4797361 0.6957361 0.8962398drug_high-control 1.330867 0.7431306 1.9186027 0.0000061drug_high-drug_low 1.222867 0.6351306 1.8106027 0.0000262from statsmodels.stats.multicomp import pairwise_tukeyhsd
pairwise_tukeyhsd(df["expression"], df["group"]) group1 group2 meandiff p-adj lower upper reject control drug_high 1.3309 0.0 0.7431 1.9186 True control drug_low 0.108 0.8962 -0.4797 0.6957 Falsedrug_high drug_low -1.2229 0.0 -1.8106 -0.6351 TrueBoth agree exactly. The high dose differs from control and from the low dose. The low dose does not differ from control. The single low-dose-versus-control p-value of 0.90 is the honest result. Running that pair as a lone t-test, ignoring the other groups, would have been the wrong analysis.
When the data is not normal: Kruskal-Wallis
Section titled “When the data is not normal: Kruskal-Wallis”If the outcome fails the normality check, the Kruskal-Wallis test is the rank-based alternative to ANOVA. It compares the distributions across groups without assuming normality.
kruskal.test(expression ~ group, data = df) Kruskal-Wallis rank sum testdata: expression by groupKruskal-Wallis chi-squared = 19.926, df = 2, p-value = 4.712e-05stats.kruskal(*groups)Kruskal-Wallis: H = 19.926, p = 4.712e-05The same boxplot, annotated with the global Kruskal-Wallis p-value instead of the pairwise Tukey brackets.
ggboxplot(df, x = "group", y = "expression", fill = "group", palette = c("#e07a5f", "#81b29a", "#4c72b0"), add = "jitter") + stat_compare_means(method = "kruskal.test")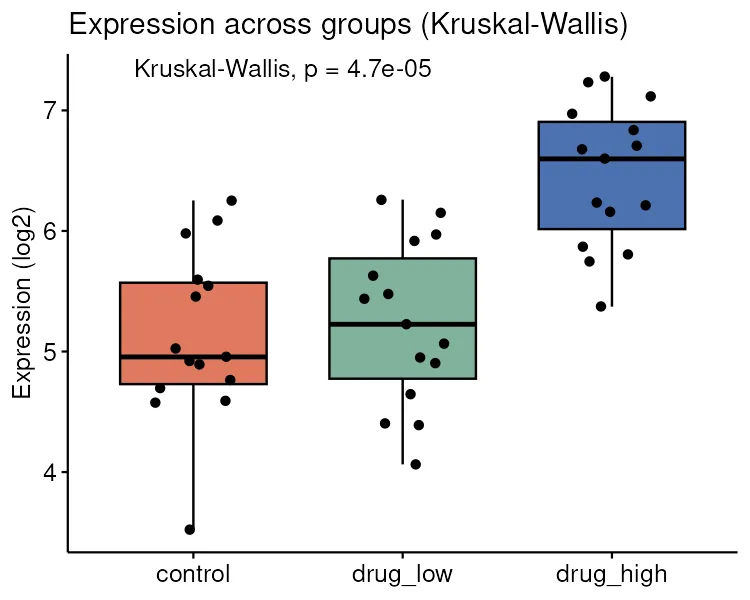
ax = sns.boxplot( data=df, x="group", y="expression", hue="group", legend=False, width=0.5, fliersize=0,)sns.stripplot(data=df, x="group", y="expression", color="black", alpha=0.6, ax=ax)ax.text(0.03, 0.97, f"Kruskal-Wallis p = {pk:.2g}", transform=ax.transAxes, va="top")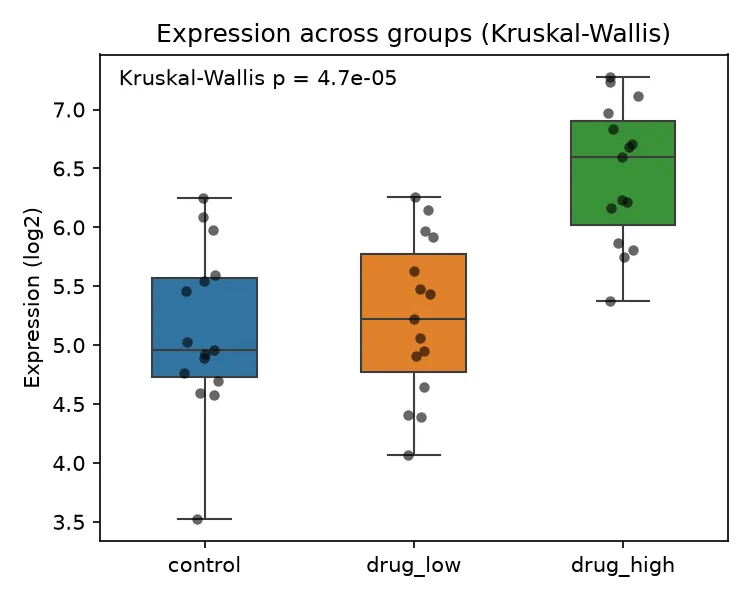
The rank-based test agrees with ANOVA. When both point the same way, the conclusion is solid.
Pitfalls and bioinformatics notes
Section titled “Pitfalls and bioinformatics notes”- Do not run all pairwise t-tests. With five groups there are ten pairs, and the chance of a false positive climbs above 40%. Use ANOVA then a post-hoc test.
- A significant ANOVA is only step one. It says some group differs. The post-hoc test says which.
- Check the assumptions. ANOVA assumes roughly normal residuals and similar variance across groups. See the Checking assumptions guide.
- This is one gene. Running an ANOVA per gene across a whole transcriptome needs multiple-testing correction on top. See the Multiple testing guide.
Key points
Section titled “Key points”- ANOVA tests whether any of three or more group means differ, controlling the false-positive rate.
- A significant ANOVA needs a post-hoc test, such as Tukey’s HSD, to find which pairs differ.
- Kruskal-Wallis is the rank-based alternative when the outcome is not normal.
Further reading
Section titled “Further reading”- STHDA, one-way ANOVA and the Kruskal-Wallis test.
- The previous guide, Two groups, for the two-group case.
- The Multiple testing guide, for running many such tests at once.