Multi-Group Comparison
Three or more groups change the figure in one way that matters. You cannot bracket every pair. Four groups have six pairwise comparisons, and drawing all six turns the plot into a ladder no one can read. The fix is to run the omnibus test first, then bracket only the pairs that survive the post-hoc correction.
This page shows expression across four genotypes. A one-way ANOVA asks whether any
mean differs; Tukey HSD then compares the pairs and adjusts for having made several
comparisons. R uses rstatix and ggpubr, Python uses pingouin and
statannotations. Both run in the pinned pubplot container.
The data
Section titled “The data”gene_expression.csv has four genotypes, wt, het, ko, and rescue, with ten
replicates each and one continuous readout. The knockout sits well above the rest.
ANOVA first, then only the significant pairs
Section titled “ANOVA first, then only the significant pairs”The omnibus p-value goes in the subtitle. The post-hoc step returns all six pairs;
the code keeps the ones below 0.05 and stacks their brackets at rising heights. Here
five of the six pairs clear the threshold. The one that does not, wt versus
rescue, is left off rather than drawn as ns.
library(ggplot2)library(ggpubr)library(rstatix)
df$genotype <- factor(df$genotype)
# Omnibus, then all pairwise Tukey comparisons.omni <- as.data.frame(anova_test(df, expression ~ genotype))ph   <- tukey_hsd(df, expression ~ genotype)sig  <- ph[ph$p.adj < 0.05, ]
# Stack the surviving brackets at rising heights.ymax <- max(df$expression); rng <- diff(range(df$expression))sig$y.position <- ymax + rng * (0.07 + 0.09 * (seq_len(nrow(sig)) - 1))sig$lab <- sig$p.adj.signif
ggplot(df, aes(genotype, expression)) +  geom_boxplot(aes(fill = genotype), width = 0.6, outlier.shape = NA,    alpha = 0.9) +  geom_jitter(aes(fill = genotype), width = 0.12, size = 1.4, alpha = 0.7,              shape = 21, stroke = 0.3) +  scale_fill_manual(values = c("#3B6DB3", "#C1432B", "#2E8B57", "#7A5195")) +  stat_pvalue_manual(sig, label = "lab", tip.length = 0.01) +  labs(x = "Genotype", y = "Expression (a.u.)",       subtitle = sprintf("One-way ANOVA, P = %.2g", omni$p[1])) +  theme_classic(base_size = 13) +  theme(legend.position = "none")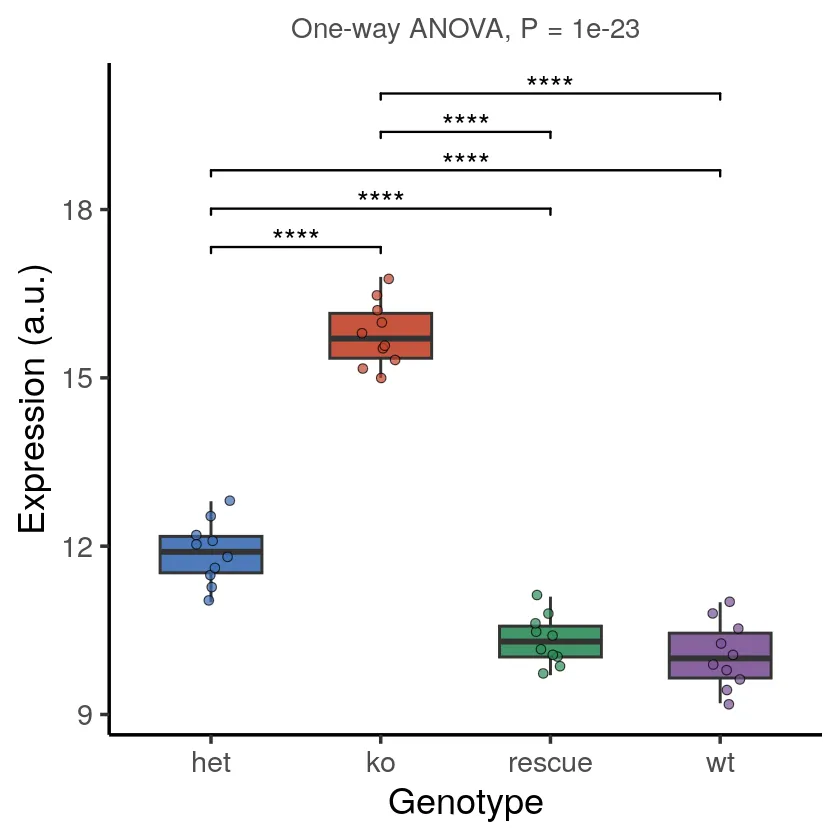
import matplotlib.pyplot as pltimport pandas as pd, seaborn as sns, pingouin as pgfrom statannotations.Annotator import Annotator

def stars(p):  # GraphPad-style significance code    """Return the significance label for a p value.
    Args:        p: P value to classify.
    Returns:        Significance label from ns to four stars.    """    for cut, mark in ((1e-4, "****"), (1e-3, "***"), (1e-2, "**"), (0.05, "*")):        if p < cut:            return mark    return "ns"

order = sorted(df["genotype"].unique())pal = dict(zip(    order, ["#3B6DB3", "#C1432B", "#2E8B57", "#7A5195"]))  # pin color to group
# Omnibus, then all pairwise Tukey comparisons.omni_p = float(    pg.anova(data=df, dv="expression", between="genotype").iloc[0]["p_unc"])ph = pg.pairwise_tukey(data=df, dv="expression", between="genotype")sig = [(str(r["A"]), str(r["B"]), float(r["p_tukey"]))       for _, r in ph.iterrows()       if r["p_tukey"] < 0.05]
fig, ax = plt.subplots(figsize=(4.6, 4.2))sns.boxplot(    data=df,    x="genotype",    y="expression",    hue="genotype",    order=order,    palette=pal,    legend=False,    width=0.6,    fliersize=0,    ax=ax,)sns.stripplot(    data=df,    x="genotype",    y="expression",    hue="genotype",    order=order,    palette=pal,    legend=False,    size=3.5,    alpha=0.7,    edgecolor="black",    linewidth=0.3,    jitter=0.12,    ax=ax,)annot = Annotator(    ax,    [(a, b) for a, b, _ in sig],    data=df,    x="genotype",    y="expression",    order=order,)annot.configure(line_width=0.9, fontsize=10)annot.set_custom_annotations([stars(p) for _, _, p in sig])annot.annotate()ax.set_title(f"One-way ANOVA, P = {omni_p:.2g}", fontsize=10, color="#4d4d4d")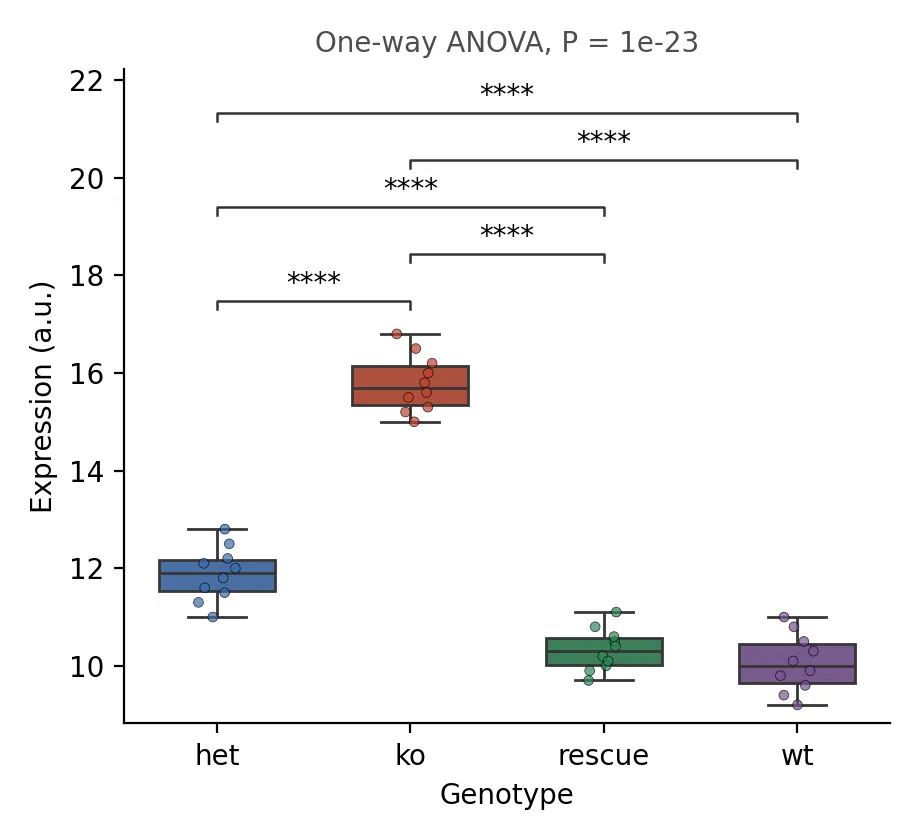
Both engines return the same ANOVA p-value, 1.0e-23, and both keep the same five
pairs. statannotations stacks its brackets top-down while ggpubr stacks
bottom-up, so the two panels order the ladder differently. The comparisons and the
stars are identical.
Making it publication-ready
Section titled “Making it publication-ready”- Report the omnibus test on the figure. A ladder of pairwise stars without the ANOVA p invites the question of whether you corrected for multiple comparisons. The subtitle answers it.
- Drop the non-significant brackets.
nsclutter buries the result. A reader assumes an unbracketed pair did not reach significance. - Use an adjusted post-hoc test, not six raw t-tests. Tukey HSD controls the family-wise error across all pairs at once.
- One color per group, held constant across panels and across languages, so a genotype reads the same wherever it appears.
The runnable scripts and fixture are in the companion code repo under
guides/figures/multi-group-comparison/.