Differential Expression
The dataset
Section titled “The dataset”import numpy as npimport pandas as pdimport scanpy as scimport matplotlib.pyplot as plt
sc.settings.verbosity = 3np.random.seed(42)
adata = sc.read_h5ad("/opt/data/kang_2018.h5ad")print(adata)print(adata.obs["label"].value_counts())print(adata.obs["cell_type"].value_counts())AnnData object with n_obs × n_vars = 24673 × 15706 obs: 'nCount_RNA', 'nFeature_RNA', 'tsne1', 'tsne2', 'label', 'cluster', 'cell_type', 'replicate', 'nCount_SCT', 'nFeature_SCT', 'integrated_snn_res.0.4', 'seurat_clusters' var: 'name' obsm: 'X_pca', 'X_umap' layers: None (.X)labelstim 12358ctrl 12315Name: count, dtype: int64cell_typeCD4 T cells 11238CD14+ Monocytes 5697B cells 2651NK cells 1716CD8 T cells 1621FCGR3A+ Monocytes 1089Dendritic cells 529Megakaryocytes 132Name: count, dtype: int64The cell-level view
Section titled “The cell-level view”# Compare conditions within one cell type, treating every cell as a# replicate. sc-best-practices shows this view inflates the false# discovery rate, because cells from one patient are not independent.cd4 = adata[adata.obs["cell_type"] == "CD4 T cells"].copy()sc.pp.normalize_total(cd4, target_sum=1e4)sc.pp.log1p(cd4)
sc.tl.rank_genes_groups(cd4, groupby="label", groups=["stim"], reference="ctrl", method="wilcoxon")de_cell_level = sc.get.rank_genes_groups_df(cd4, group="stim")print(de_cell_level.head(10).to_string(index=False))names scores logfoldchanges pvals pvals_adjISG15 87.675537 6.587747 0.0 0.0 IFI6 80.029068 6.972263 0.0 0.0ISG20 76.741043 4.003573 0.0 0.0IFIT3 73.735214 8.247092 0.0 0.0IFIT1 70.644501 7.860435 0.0 0.0 LY6E 68.401077 5.068758 0.0 0.0 MX1 65.853409 5.566489 0.0 0.0 B2M 60.497433 0.603757 0.0 0.0IFIT2 52.917747 6.954865 0.0 0.0 OAS1 49.499474 5.650621 0.0 0.0Pseudobulk
Section titled “Pseudobulk”import decoupler as dc
# Aggregate the counts per patient and cell type. One pseudobulk sample# per patient, condition and cell type: 8 patients x 2 conditions x 8# cell types in principle, 112 in practice.pdata = dc.pp.pseudobulk(adata, sample_col="replicate", groups_col=["label", "cell_type"], mode="sum", verbose=False)
# decoupler fills the combinations a patient does not contribute to# with zero counts, and those empty rows also carry broken metadata,# so drop them.pdata = pdata[pdata.obs["psbulk_cells"] > 0].copy()print(pdata)print(pdata.obs["label"].value_counts())AnnData object with n_obs × n_vars = 124 × 15706 obs: 'replicate', 'label_cell_type', 'label', 'cell_type', 'psbulk_cells', 'psbulk_counts' var: 'name' layers: 'psbulk_props', None (.X)labelctrl 63stim 61Name: count, dtype: int64cd4_pb = pdata[pdata.obs["cell_type"] == "CD4 T cells"].copy()print(cd4_pb.n_obs, "CD4 T cell pseudobulks")
# Explore the pseudobulks before modeling. PCA on the samples shows# whether the condition dominates the variation.sc.pp.normalize_total(cd4_pb, target_sum=1e4)sc.pp.log1p(cd4_pb)sc.pp.scale(cd4_pb, max_value=10)sc.tl.pca(cd4_pb, n_comps=10, random_state=42)# 16 points: shrink the dots from scanpy's cell-scale default.sc.pl.pca(cd4_pb, color="label", size=40, show=False)plt.savefig("outputs/differential-expression_pca.png", dpi=150, bbox_inches="tight")plt.close()16 CD4 T cell pseudobulks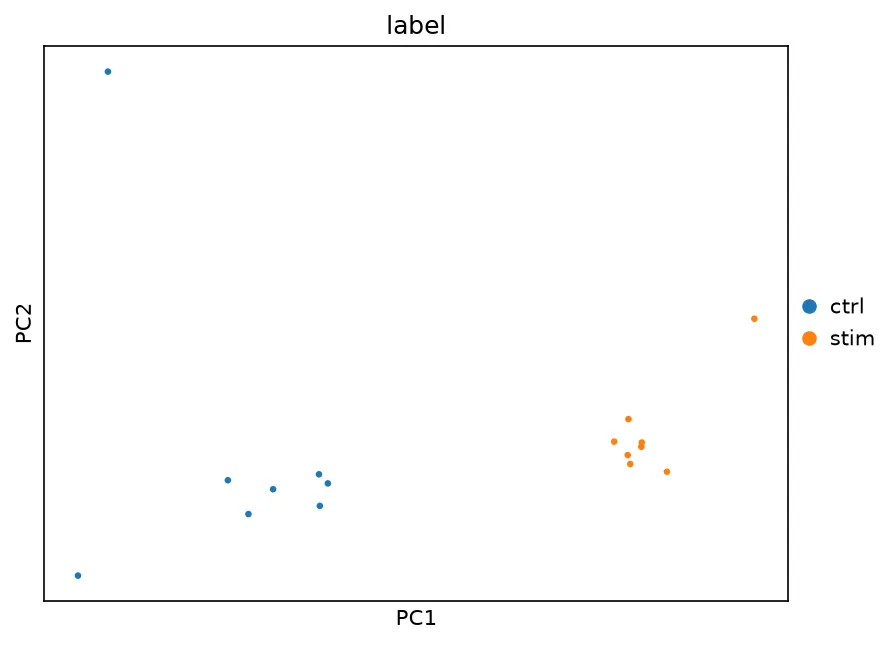
Filter and test
Section titled “Filter and test”# Remove lowly expressed genes, separately for this cell type, before# the model.cd4_pb = pdata[pdata.obs["cell_type"] == "CD4 T cells"].copy()dc.pp.filter_by_expr(cd4_pb, group="label", min_count=10, min_total_count=15)print(cd4_pb.shape)
from pydeseq2.dds import DeseqDataSetfrom pydeseq2.ds import DeseqStats
counts = cd4_pb.to_df().astype(int)metadata = cd4_pb.obs[["label", "replicate"]]
# The design blocks on the patient, so the condition effect is# estimated within patients.dds = DeseqDataSet(counts=counts, metadata=metadata, design="~ label + replicate", ref_level=["label", "ctrl"], quiet=True)dds.deseq2()stats = DeseqStats(dds, contrast=["label", "stim", "ctrl"], quiet=True)stats.summary()
de_pseudobulk = stats.results_df.sort_values("padj")print(de_pseudobulk.head(10).to_string())print("significant at padj < 0.05:", int((de_pseudobulk["padj"] < 0.05).sum()))(16, 5159) baseMean log2FoldChange lfcSE stat pvalue padjindexISG20 1509.146999 3.063848 0.073911 41.453114 0.000000e+00 0.000000e+00TNFSF10 292.675552 4.388434 0.140119 31.319225 2.554415e-215 6.589113e-212BST2 224.632691 2.429823 0.086237 28.176230 1.143746e-174 1.966862e-171PSMB9 524.773807 1.694189 0.061767 27.428682 1.248003e-165 1.609612e-162IRF7 269.087570 3.414138 0.125294 27.249006 1.707549e-163 1.761849e-160LY6E 578.418419 4.122293 0.151493 27.211081 4.802571e-163 3.932896e-160GBP1 197.969970 3.742823 0.137567 27.207213 5.336358e-163 3.932896e-160DRAP1 298.407798 1.930828 0.072805 26.520522 5.621050e-155 3.624875e-152MT2A 346.704642 4.244987 0.160454 26.456043 3.108980e-154 1.782136e-151UBE2L6 321.916230 2.597496 0.101012 25.714812 7.982627e-146 4.118237e-143significant at padj < 0.05: 1173Comparing the two views
Section titled “Comparing the two views”top_cell = set(de_cell_level.head(20)["names"])top_bulk = set(de_pseudobulk.head(20).index)print(len(top_cell & top_bulk), "genes shared by both top-20 lists")11 genes shared by both top-20 lists