Factorial ANOVA
When an experiment crosses two factors, genotype by treatment, the interesting number is not either main effect. It is the interaction. Does the treatment do the same thing in the knockout as in the wild type, or does the genotype change how the drug acts? A grouped box plot shows the cells, and a factorial ANOVA puts a p-value on that question.
This page draws the grouped box and reports a Type II ANOVA: the two main effects and
their interaction. R uses rstatix, Python uses statsmodels. Both run in the pinned
pubplot container and agree on all three p-values.
The data
Section titled “The data”twoway_response.csv crosses two genotypes (ko, wt) with three treatments
(vehicle, low, high), roughly eight replicates per cell, one continuous
response. The design has a built-in interaction: the treatments separate cleanly in
the knockout and collapse in the wild type.
Grouped box, factorial ANOVA
Section titled “Grouped box, factorial ANOVA”Dodge the treatment within each genotype so the cells sit side by side. The subtitle carries the ANOVA. Type II sums of squares are the right default when the design is close to balanced and you want each effect adjusted for the others.
library(ggplot2)library(rstatix)
df$genotype  <- factor(df$genotype)df$treatment <- factor(df$treatment)
# Type II ANOVA: two main effects and their interaction.at  <- as.data.frame(anova_test(df, response ~ genotype * treatment, type = 2))sig <- at[at$p < 0.05, ]sub <- paste(sprintf("%s: P = %.2g", gsub(":", " × ", sig$Effect), sig$p),             collapse = "\n")
ggplot(df, aes(genotype, response, fill = treatment)) +  geom_boxplot(position = position_dodge(0.8), width = 0.7,               outlier.shape = NA, alpha = 0.9) +  geom_point(position = position_jitterdodge(jitter.width = 0.15,    dodge.width = 0.8),             size = 1.3, alpha = 0.7, shape = 21, stroke = 0.3) +  scale_fill_manual(values = c("#3B6DB3", "#C1432B", "#2E8B57")) +  labs(x = "Genotype", y = "Response (a.u.)", fill = "Treatment",    subtitle = sub) +  theme_classic(base_size = 13) +  theme(plot.subtitle = element_text(hjust = 0.5, size = 9.5,    colour = "grey30"))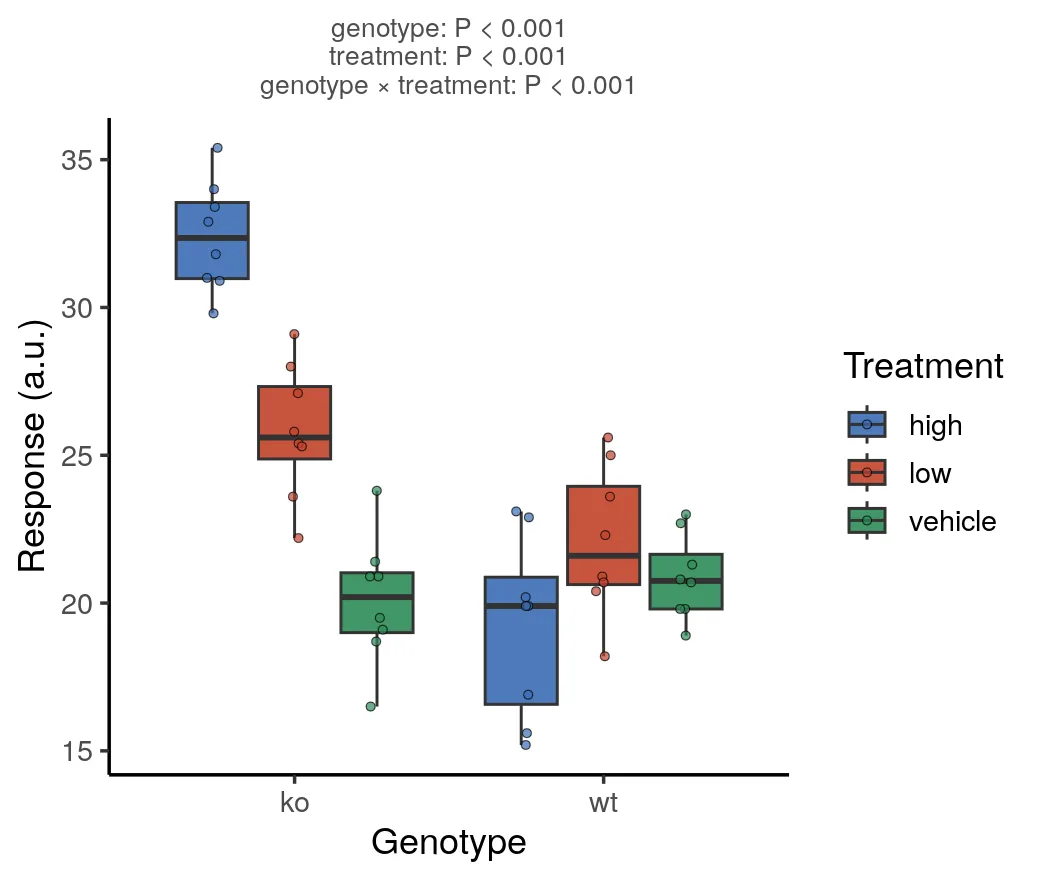
import matplotlib.pyplot as plt, matplotlib.patches as mpatchesimport pandas as pd, seaborn as snsimport statsmodels.api as sm, statsmodels.formula.api as smf
xorder, torder = (    sorted(df["genotype"].unique()),    sorted(df["treatment"].unique()),)pal = dict(zip(torder,               ["#3B6DB3", "#C1432B", "#2E8B57"]))  # pin color to treatment
# Type II ANOVA: two main effects and their interaction.aov = sm.stats.anova_lm(smf.ols("response ~ C(genotype) * C(treatment)",                                df).fit(),                        typ=2)
fig, ax = plt.subplots(figsize=(5.2, 4.4))sns.boxplot(    data=df,    x="genotype",    y="response",    hue="treatment",    order=xorder,    hue_order=torder,    palette=pal,    width=0.7,    fliersize=0,    legend=False,    ax=ax,)sns.stripplot(    data=df,    x="genotype",    y="response",    hue="treatment",    order=xorder,    hue_order=torder,    dodge=True,    palette=pal,    size=3,    alpha=0.6,    edgecolor="black",    linewidth=0.3,    legend=False,    ax=ax,)ax.legend(    handles=[mpatches.Patch(color=pal[t], label=t) for t in torder],    title="Treatment",    loc="center left",    bbox_to_anchor=(1.02, 0.5),    frameon=False,)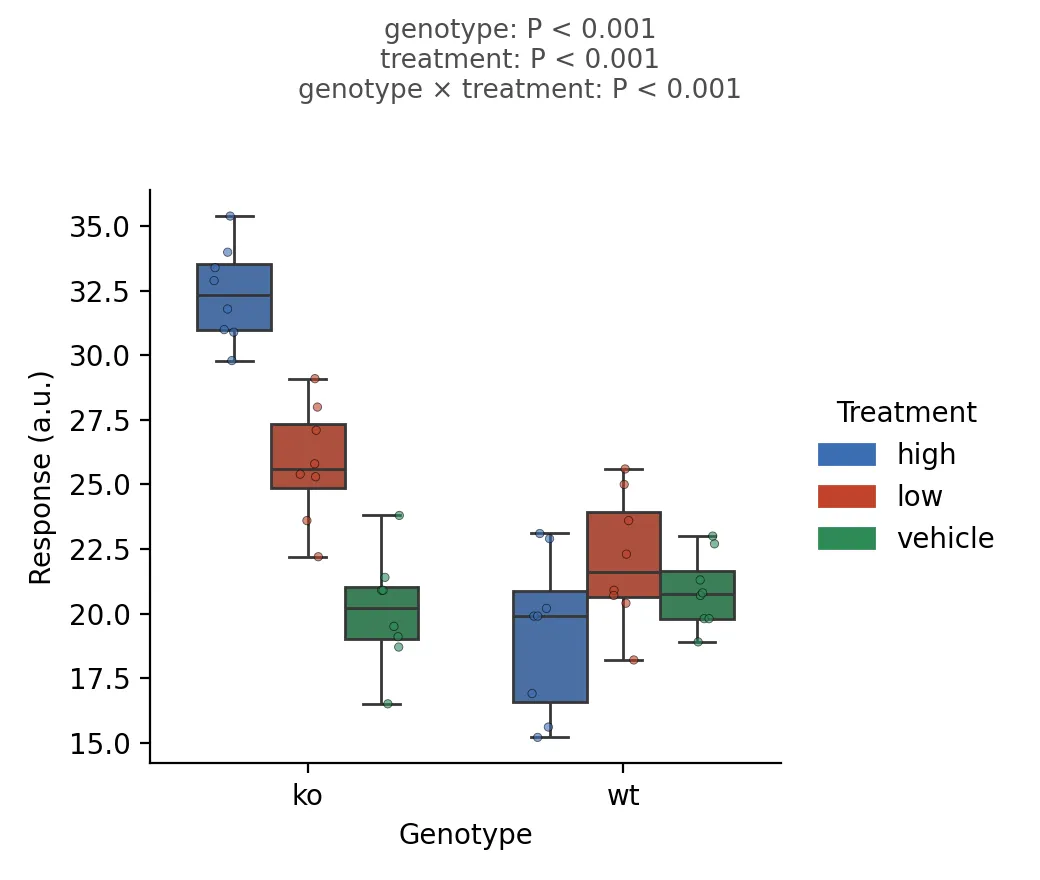
Both engines return the same three p-values: genotype 2.9e-10, treatment 2.2e-7, and the interaction 2.3e-10. The interaction is real, and the plot shows why. In the knockout the three treatments fan out; in the wild type they nearly overlap. A single main-effect bar chart would have hidden that.
Making it publication-ready
Section titled “Making it publication-ready”- Put the interaction on the figure, not just the main effects. It is the term a factorial design exists to test.
- Dodge, do not stack or facet, for two factors. Side-by-side boxes let the eye compare cells within a genotype directly.
- Keep one legend, placed outside the plotting area, so it never sits on a data point.
- Hold the treatment colors identical to the two-group and multi-group pages, so a reader moving through the section is not relearning the palette.
For three factors, add the third as a facet row rather than a fourth color. The
runnable scripts and fixture are in the companion code repo under
guides/figures/factorial-anova/.