Quality Control
Per-cell metrics
Section titled “Per-cell metrics”| Metric | Typical Range | Flag If |
|---|---|---|
| nCount_RNA | 1,000-50,000 | <500 or >50,000 |
| nFeature_RNA | 500-5,000 | <200 or >6,000 |
| percent.mt | 0-10% | >20% |
- nCount_RNA: Total UMIs (library size)
- nFeature_RNA: Unique genes detected
- percent.mt: Mitochondrial % (dead/dying cells)
import numpy as npimport scanpy as scimport matplotlib.pyplot as plt
sc.settings.verbosity = 3sc.settings.set_figure_params(dpi=80, facecolor="white", frameon=False)np.random.seed(42)
adata = sc.read_10x_mtx("/opt/data/pbmc3k", var_names="gene_symbols",                        make_unique=True)adata.layers["counts"] = adata.X.copy()
# Scanpy names the three metrics above total_counts, n_genes_by_counts# and pct_counts_mt.adata.var["mt"] = adata.var_names.str.startswith("MT-")sc.pp.calculate_qc_metrics(adata, qc_vars=["mt"], percent_top=None,                           log1p=False, inplace=True)
print(adata.obs.head().to_string())
n_genes_by_counts total_counts total_counts_mt pct_counts_mtAAACATACAACCAC-1 781 2421.0 73.0 3.015283AAACATTGAGCTAC-1 1352 4903.0 186.0 3.793596AAACATTGATCAGC-1 1131 3149.0 28.0 0.889171AAACCGTGCTTCCG-1 960 2639.0 46.0 1.743085AAACCGTGTATGCG-1 522 981.0 12.0 1.223242sc.pl.violin(adata, ["n_genes_by_counts", "total_counts", "pct_counts_mt"], multi_panel=True, jitter=0.4, size=1.5, show=False)plt.savefig("outputs/quality-control_violin.png", dpi=150, bbox_inches="tight")plt.close()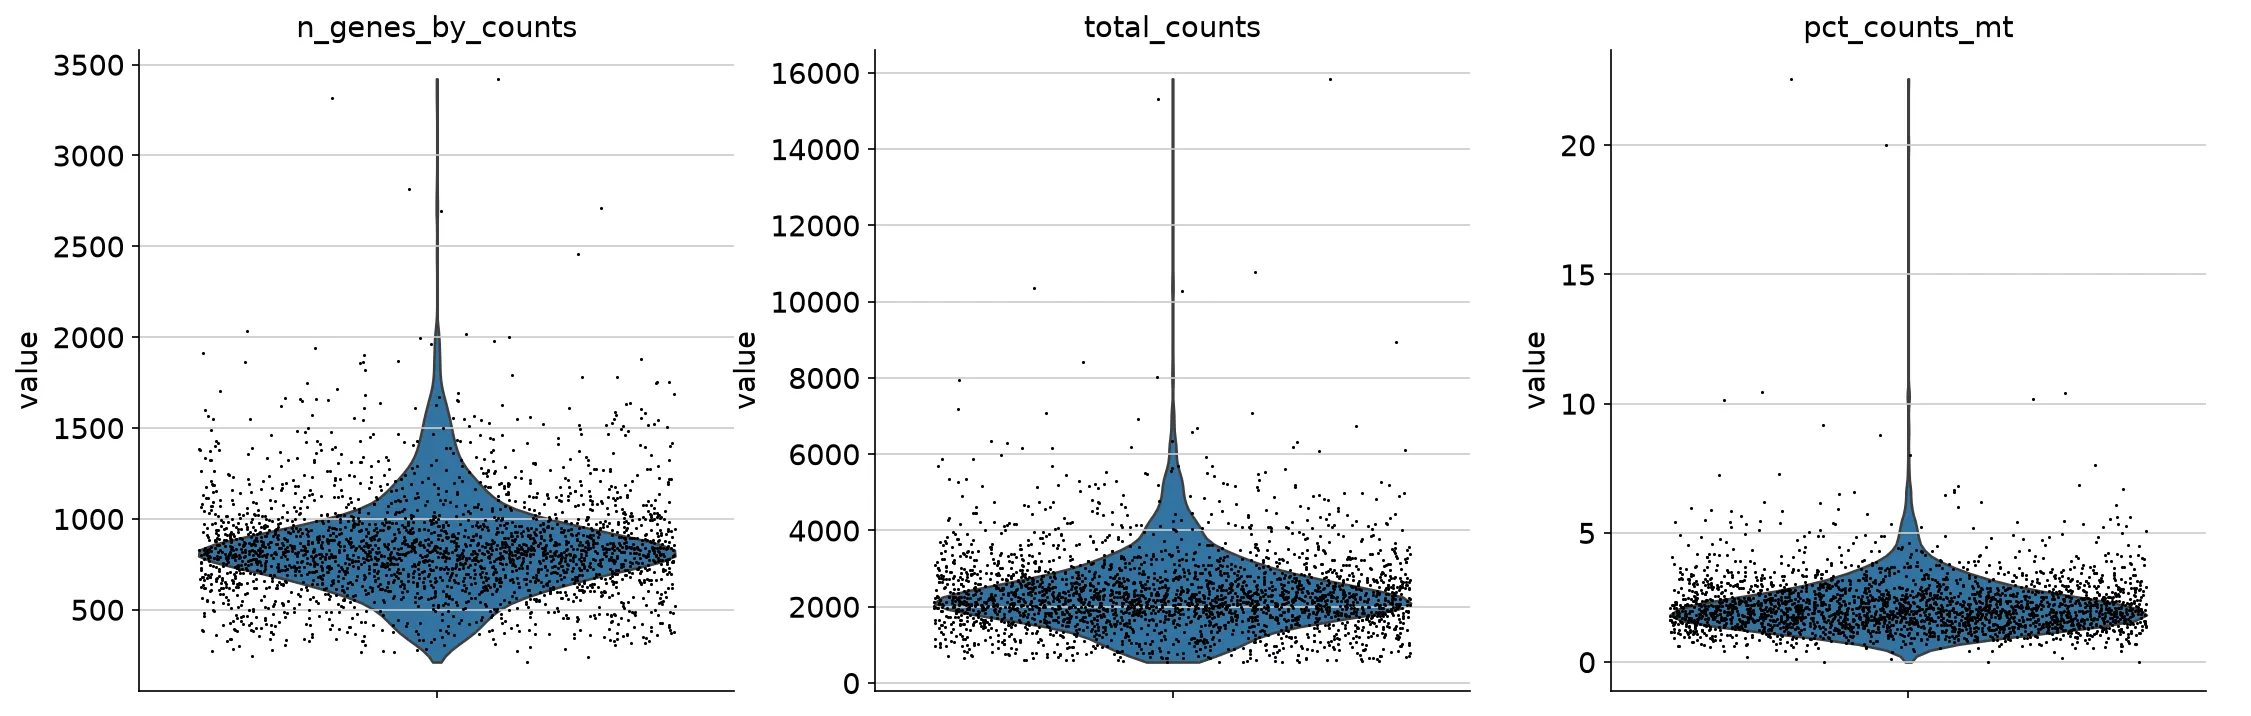
fig, axes = plt.subplots(1, 2, figsize=(10, 4))sc.pl.scatter(adata, x="total_counts", y="pct_counts_mt", ax=axes[0], show=False)sc.pl.scatter(adata, x="total_counts", y="n_genes_by_counts", ax=axes[1], show=False)plt.tight_layout()plt.savefig("outputs/quality-control_scatter.png", dpi=150, bbox_inches="tight")plt.close()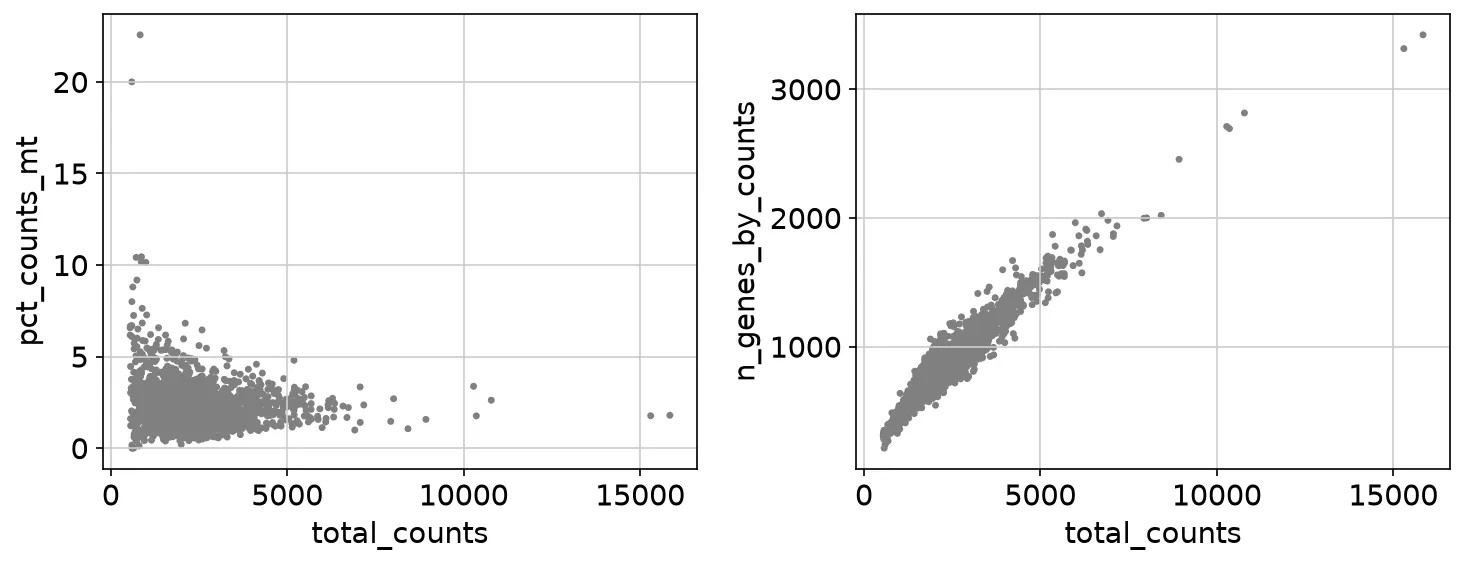
MAD-based filtering
Section titled “MAD-based filtering”def is_outlier(adata, metric, nmads): """Flag cells whose metric sits more than nmads MADs from the median.
Args: adata: AnnData object holding the metric in .obs. metric: Column of adata.obs to test. nmads: Number of median absolute deviations for the cutoff.
Returns: Boolean Series, True where the cell is an outlier. """ values = adata.obs[metric] median = values.median() mad = (values - median).abs().median() return (values < median - nmads * mad) | (values > median + nmads * mad)
# sc-best-practices filters on median absolute deviations with lenient# cutoffs, 5 MADs for the count metrics and 3 for the mitochondrial# fraction, rather than on fixed thresholds.adata.obs["log1p_total_counts"] = np.log1p(adata.obs["total_counts"])adata.obs["log1p_n_genes_by_counts"] = np.log1p( adata.obs["n_genes_by_counts"])
adata.obs["outlier"] = ( is_outlier(adata, "log1p_total_counts", 5) | is_outlier(adata, "log1p_n_genes_by_counts", 5) | is_outlier(adata, "pct_counts_mt", 3))print(adata.obs["outlier"].value_counts())outlierFalse 2428True 272Name: count, dtype: int64adata = adata[~adata.obs["outlier"]].copy()print(f"{adata.n_obs} cells remain")2428 cells remainFiltering genes
Section titled “Filtering genes”# Filter genes expressed in fewer than 3 cells. sc-best-practices# reports no clear downstream benefit from gene filtering, but it# shrinks the matrix.sc.pp.filter_genes(adata, min_cells=3)print(adata.shape)(2428, 13474)