Mass Spectrometry Files
A mass spectrometer records spectra. Each scan is a list of peaks, and a peak is a pair of numbers: a mass-to-charge ratio and an intensity. A run of an hour holds tens of thousands of scans, and the file formats split into two families. The vendor formats are what the instrument writes, and mzML is the open standard the community converts them into.
From vendor raw to mzML
Section titled “From vendor raw to mzML”Every vendor writes its own container, and none of them are documented for outside parsing.
| Vendor | Format | Shape |
|---|---|---|
| Thermo Fisher | .raw |
Single binary file |
| Bruker | .d |
Directory holding .baf or .tdf files |
| Agilent | .d |
Directory of binaries |
| Waters | .raw |
Directory of binaries |
| SCIEX | .wiff |
Binary file plus a .scan companion |
The conversion tool is msconvert from ProteoWizard. It reads every vendor
format above and writes mzML, optionally with peak picking and filters applied.
The conversion is where the analysis starts, and keeping the raw files matters:
mzML with peak picking applied cannot be un-picked.
mzML itself is XML defined by the HUPO Proteomics Standards Initiative, with the peak lists stored as base64-encoded binary arrays inside the XML. The head of a real file shows the structure: controlled vocabulary declarations, then a description of the file and its source.
mzml_file <- system.file("microtofq", "MM14.mzML", package = "msdata")file.size(mzml_file)
# mzML is XML. The first lines declare the vocabularies and the source file.mzml_lines <- readLines(mzml_file, n = 15)cat(substr(mzml_lines, 1, 100), sep = "\n")
[1] 3651990<?xml version="1.0" encoding="ISO-8859-1"?><mzML xmlns="http://psi.hupo.org/ms/mzml" xmlns:xsi="http://www.w3.org/2001/XMLSchema-instance" xsi: <cvList count="2"> <cv id="MS" fullName="Proteomics Standards Initiative Mass Spectrometry Ontology" URI="http://psid <cv id="UO" fullName="Unit Ontology" URI="http://obo.cvs.sourceforge.net/obo/obo/ontology/phenotyp </cvList> <fileDescription> <fileContent> <cvParam cvRef="MS" accession="MS:1000294" name="mass spectrum" /> </fileContent> <sourceFileList count="1"> <sourceFile id="sf_ru_0" name="analysis.baf" location="MM14_20uM_2-A%2c4_01_1745.d/"> <cvParam cvRef="MS" accession="MS:1000569" name="SHA-1" value="" /> <cvParam cvRef="MS" accession="MS:1000564" name="PSI mzData file" /> <cvParam cvRef="MS" accession="MS:1000824" name="no nativeID format" />This file records its own provenance. The source was analysis.baf inside a
directory ending in .d, which is a Bruker raw file, converted to mzML before
analysis. The cvParam elements are controlled vocabulary terms: rather than
free text, every property is a numbered term from a shared ontology, so two
programs that both say MS:1000294 both mean a mass spectrum.
The example is a MALDI-TOF run on a Bruker Microtof Q, shipped by the msdata package and used across the Bioconductor mass spectrometry documentation.
Reading with mzR
Section titled “Reading with mzR”mzR is the Bioconductor reader for mzML and its predecessors. It gives the run header, one row per scan, and the peak matrix of any scan.
library(mzR)
ms <- openMSfile(mzml_file)hd <- header(ms)
nrow(hd)table(hd$msLevel)range(hd$peaksCount)head(hd[, c("seqNum", "msLevel", "retentionTime", "peaksCount",            "basePeakMZ")], 5)
[1] 112
1112[1] 1301 1695 seqNum msLevel retentionTime peaksCount basePeakMZ1 1 1 270.334 1378 02 2 1 270.671 1356 03 3 1 271.007 1404 04 4 1 271.343 1496 05 5 1 271.680 1525 0The run holds 112 scans, all at MS level 1, each with around fifteen hundred peaks. In a tandem run the header also carries MS2 rows, and the precursor columns say which MS1 ion each MS2 scan fragmented.
# The scan with the most peaks, as an mz by intensity matrix.scan_i <- which.max(hd$peaksCount)scan_ipeaks_scan <- peaks(ms, scan_i)dim(peaks_scan)head(peaks_scan, 4)close(ms)[1] 25[1] 1695 2 mz intensity[1,] 100.0274 34[2,] 105.1012 30[3,] 110.0472 39[4,] 116.0829 21Scan 25 is the densest of the run. The peak matrix is what every downstream tool consumes, and drawn as stems it is the picture every mass spectrometrist recognises.
library(ggplot2)
spectrum_plot <- ggplot(data.frame(peaks_scan),                        aes(x = mz, xend = mz, y = 0, yend = intensity)) +  geom_segment(linewidth = 0.2) +  labs(x = "m/z", y = "Intensity",       title = paste("Scan", scan_i, "of MM14.mzML"))
dir.create("outputs", showWarnings = FALSE, recursive = TRUE)ggsave("outputs/mass_spec_scan.png", plot = spectrum_plot,       width = 7, height = 4, dpi = 110, bg = "white")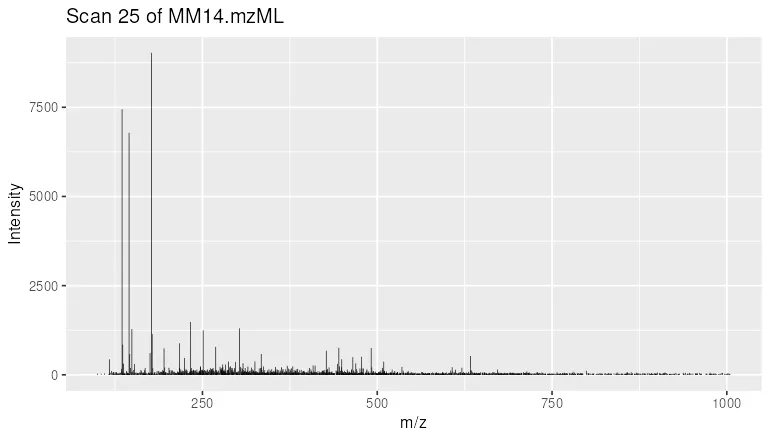
The companion formats
Section titled “The companion formats”mzML covers the raw spectra. The steps after identification have their own standards, all from the same initiative.
| Format | What it stores | Read by |
|---|---|---|
| mzXML | Spectra, the older ISB schema | mzR |
| mzIdentML | Peptide and protein identifications | mzR, mzID |
| mzTab | Identification and quantitation results | base R, it is tab-delimited |
| mgf | Peak lists as plain text, for search engines | MSnbase, search engines |
The mgf is the one you can read with no tools at all, which is why database search engines took it as input.
BEGIN IONSTITLE=scan 1234PEPMASS=842.51CHARGE=2+RTINSECONDS=271.3110.14 1023111.09 441...END IONSSummary
Section titled “Summary”- Vendor raw formats are proprietary. Convert to mzML with
msconvert, and keep the originals. - mzML is XML with base64 peak arrays, defined by numbered controlled vocabulary terms, and it records the source file it was converted from.
- mzR reads mzML:
headerfor the per-scan table,peaksfor the peak matrix of one scan. - Identifications travel as mzIdentML, quantitation as mzTab, and search engine peak lists as mgf.