Luminex
Luminex measures several analytes in one well with bead sets. Each bead region carries a distinct fluorescence signature and one antibody, so the instrument can tell fifty or a hundred analytes apart in a single sample. Two lasers do the reading: one classifies the bead region, and one measures the reporter signal on the bead. The raw number per analyte per well is a median fluorescence intensity, and concentrations come from a standard curve fitted per run.
The files
Section titled “The files”The instrument’s own record is a binary .lxb file per well, which the
acquisition software reads. The file that reaches the analyst is the export from
that software. xPONENT writes a batch CSV, and Bio-Plex Manager, Bio-Rad’s
branded build of the same platform, writes its own CSV or XML. The layouts
differ, but the content is the same long table: one row per well per analyte,
with the bead count and the fluorescence summary.
The example reads a synthetic export in the xPONENT shape: a seven-point standard series in a three-fold dilution, eight unknown samples, three analytes.
library(readr)
lux <- read_csv("/opt/data/xponent_export.csv", show_col_types = FALSE)dim(lux)head(lux, 4)
[1] 45 7# A tibble: 4 × 7 Well Sample Analyte `Bead Count` `Median FI` `Net MFI` `Dilution Factor` <chr> <chr> <chr> <dbl> <dbl> <dbl> <dbl>1 A01 Std1 IL-6 69 18321 18276 12 A01 Std1 IL-8 48 22708 22663 13 A01 Std1 TNF-alpha 108 15179 15134 14 A02 Std2 IL-6 52 6037 5992 3Every row is one well read for one analyte. Bead Count is how many beads of
that region the instrument counted, Median FI is the median reporter
fluorescence across those beads, and Net MFI subtracts the background.
Bead count first
Section titled “Bead count first”The bead count is the quality check that comes with the file. Too few beads means the median rests on too little evidence, and the common threshold is 35 beads. Check it before touching the fluorescence values.
library(dplyr)
# Below 35 beads, the median is unreliable.lux %>% filter(`Bead Count` < 35)
lux_clean <- lux %>% filter(`Bead Count` >= 35)cat(nrow(lux) - nrow(lux_clean), "row(s) dropped on bead count\n")
# A tibble: 1 × 7 Well Sample Analyte `Bead Count` `Median FI` `Net MFI` `Dilution Factor` <chr> <chr> <chr> <dbl> <dbl> <dbl> <dbl>1 C05 Sample_05 IL-8 12 2374 2329 NA1 row(s) dropped on bead countOne well in the fixture falls below the threshold: sample 5 read for IL-8. The row is dropped, and any concentration derived from it would have been wrong silently.
The standard curve
Section titled “The standard curve”The standards travel in the same file as the samples. Each dilution of the standard gives a fluorescence value per analyte, and the run’s software fits a five-parameter logistic to convert sample fluorescence into concentration. On a log-log plot the standards should fall on a clean monotone curve.
library(ggplot2)
standards <- lux_clean %>% filter(grepl("^Std", Sample))
standards %>%  group_by(Analyte, `Dilution Factor`) %>%  summarise(median_fi = median(`Median FI`), .groups = "drop") %>%  arrange(Analyte, `Dilution Factor`) %>%  print(n = 21)
curve_plot <- ggplot(standards,                     aes(x = `Dilution Factor`, y = `Median FI`,                         colour = Analyte)) +  geom_point(size = 2) +  scale_x_log10() +  scale_y_log10() +  labs(x = "Dilution factor (log scale)",       y = "Median fluorescence intensity")
dir.create("outputs", showWarnings = FALSE, recursive = TRUE)ggsave("outputs/luminex_standard_curve.png", plot = curve_plot,       width = 7, height = 4, dpi = 110, bg = "white")
# A tibble: 21 × 3 Analyte `Dilution Factor` median_fi <chr> <dbl> <dbl> 1 IL-6 1 18321 2 IL-6 3 6037 3 IL-6 9 1991 4 IL-6 27 661 5 IL-6 81 211 6 IL-6 243 72 7 IL-6 729 24 8 IL-8 1 22708 9 IL-8 3 728410 IL-8 9 244011 IL-8 27 85012 IL-8 81 27413 IL-8 243 9414 IL-8 729 3215 TNF-alpha 1 1517916 TNF-alpha 3 502917 TNF-alpha 9 165718 TNF-alpha 27 60119 TNF-alpha 81 17620 TNF-alpha 243 6521 TNF-alpha 729 21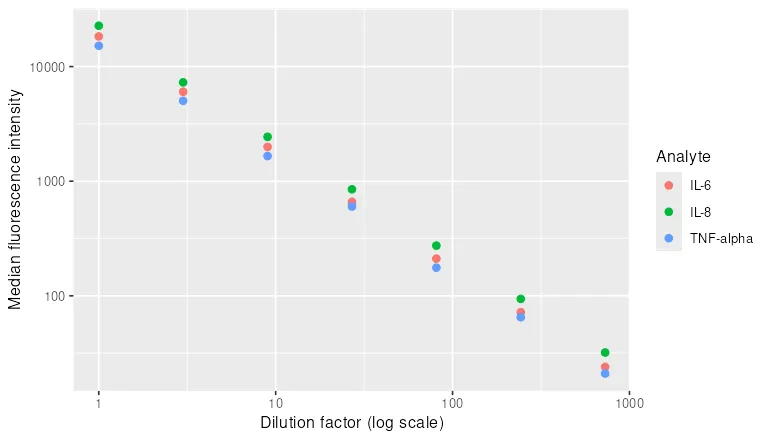
The fixture’s curve is straight by construction; a real run bends at both ends,
which is why the fit is a five-parameter logistic rather than a line. The fitting
lives in the acquisition software, and in R the drLumi and nCal packages
implement it for xPONENT and Bio-Plex exports. This page stops at the file: the
fluorescence values, the bead counts, and the standards.
Summary
Section titled “Summary”- Luminex reports a median fluorescence intensity per analyte per well, from a bead count of a few dozen beads.
- The analyst’s file is the software export, a long table of well by analyte.
The per-well binary
.lxbstays with the instrument. - Check the bead count before anything else. Below 35 beads, the median is not to be trusted.
- Concentrations come from a per-run standard curve, a five-parameter logistic fitted to the dilution series in the same file.